
Create successful ePaper yourself
Turn your PDF publications into a flip-book with our unique Google optimized e-Paper software.
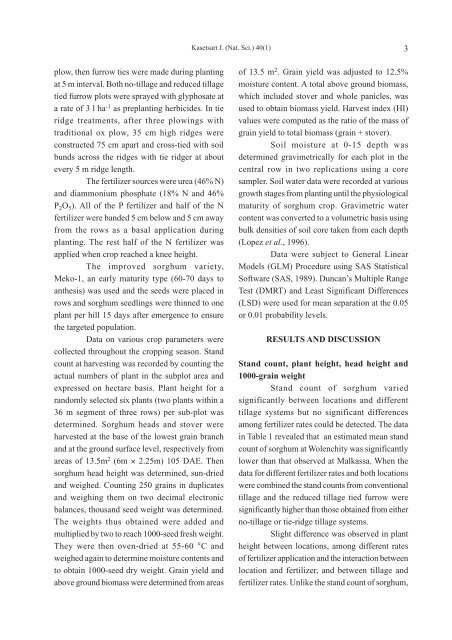
plow, then furrow ties were made during planting<br />
at 5 m interval. Both no-tillage and reduced tillage<br />
tied furrow plots were sprayed with glyphosate at<br />
a rate of 3 l ha -1 as preplanting herbicides. In tie<br />
ridge treatments, after three plowings with<br />
traditional ox plow, 35 cm high ridges were<br />
constructed 75 cm apart and cross-tied with soil<br />
bunds across the ridges with tie ridger at about<br />
every 5 m ridge length.<br />
The fertilizer sources were urea (46% N)<br />
and diammonium phosphate (18% N and 46%<br />
P 2O 5). All of the P fertilizer and half of the N<br />
fertilizer were banded 5 cm below and 5 cm away<br />
from the rows as a basal application during<br />
planting. The rest half of the N fertilizer was<br />
applied when crop reached a knee height.<br />
The improved sorghum variety,<br />
Meko-1, an early maturity type (60-70 days to<br />
anthesis) was used and the seeds were placed in<br />
rows and sorghum seedlings were thinned to one<br />
plant per hill 15 days after emergence to ensure<br />
the targeted population.<br />
Data on various crop parameters were<br />
collected throughout the cropping season. Stand<br />
count at harvesting was recorded by counting the<br />
actual numbers of plant in the subplot area and<br />
expressed on hectare basis. Plant height for a<br />
randomly selected six plants (two plants within a<br />
36 m segment of three rows) per sub-plot was<br />
determined. Sorghum heads and stover were<br />
harvested at the base of the lowest grain branch<br />
and at the ground surface level, respectively from<br />
areas of 13.5m 2 (6m × 2.25m) 105 DAE. Then<br />
sorghum head height was determined, sun-dried<br />
and weighed. Counting 250 grains in duplicates<br />
and weighing them on two decimal electronic<br />
balances, thousand seed weight was determined.<br />
The weights thus obtained were added and<br />
multiplied by two to reach 1000-seed fresh weight.<br />
They were then oven-dried at 55-60 °C and<br />
weighed again to determine moisture contents and<br />
to obtain 1000-seed dry weight. Grain yield and<br />
above ground biomass were determined from areas<br />
Kasetsart J. (Nat. Sci.) 40(1) 3<br />
of 13.5 m 2 . Grain yield was adjusted to 12.5%<br />
moisture content. A total above ground biomass,<br />
which included stover and whole panicles, was<br />
used to obtain biomass yield. Harvest index (HI)<br />
values were computed as the ratio of the mass of<br />
grain yield to total biomass (grain + stover).<br />
Soil moisture at 0-15 depth was<br />
determined gravimetrically for each plot in the<br />
central row in two replications using a core<br />
sampler. Soil water data were recorded at various<br />
growth stages from planting until the physiological<br />
maturity of sorghum crop. Gravimetric water<br />
content was converted to a volumetric basis using<br />
bulk densities of soil core taken from each depth<br />
(Lopez et al., 1996).<br />
Data were subject to General Linear<br />
Models (GLM) Procedure using SAS Statistical<br />
Software (SAS, 1989). Duncan’s Multiple Range<br />
Test (DMRT) and Least Significant Differences<br />
(LSD) were used for mean separation at the 0.05<br />
or 0.01 probability levels.<br />
RESULTS AND DISCUSSION<br />
Stand count, plant height, head height and<br />
1000-grain weight<br />
Stand count of sorghum varied<br />
significantly between locations and different<br />
tillage systems but no significant differences<br />
among fertilizer rates could be detected. The data<br />
in Table 1 revealed that an estimated mean stand<br />
count of sorghum at Wolenchity was significantly<br />
lower than that observed at Malkassa. When the<br />
data for different fertilizer rates and both locations<br />
were combined the stand counts from conventional<br />
tillage and the reduced tillage tied furrow were<br />
significantly higher than those obtained from either<br />
no-tillage or tie-ridge tillage systems.<br />
Slight difference was observed in plant<br />
height between locations, among different rates<br />
of fertilizer application and the interaction between<br />
location and fertilizer, and between tillage and<br />
fertilizer rates. Unlike the stand count of sorghum,