
You also want an ePaper? Increase the reach of your titles
YUMPU automatically turns print PDFs into web optimized ePapers that Google loves.
206<br />
water until the water became clear. After washing,<br />
the bags were placed into a hot dry air force oven<br />
at 65 °C for 48 h and weighed. To determine the<br />
content of water soluble material bags,<br />
representing 0 h degradation also underwent the<br />
same washing procedure as the incubated bags.<br />
Dried residues of each incubation time from each<br />
steer were pooled, for DM, OM and CP analyzed,<br />
then DM, OM and CP disappearance values were<br />
calculated for the difference between nutrient<br />
weight before and after incubation of each sample.<br />
The degradability data obtained for DM, OM and<br />
CP for each feed was fitted to the equation P= a+b<br />
(1-e -ct ) (∅rskov and McDonald, 1979). The<br />
effective degradability was calculated as<br />
ED=a+b{c/(c+k)}, where K = fractional passage<br />
rate (0.02/h)<br />
Statistical analysis<br />
All data obtained were subjected to the<br />
analysis of variance (ANOVA) procedure<br />
according to the Complete Randomized Design<br />
using the general linear (GLM) of the SAS system<br />
(SAS, 1996). Treatment means were compared<br />
using Duncan’s New Multiple Range test.<br />
Probabilities less than 0.05 were considered to be<br />
significant.<br />
Kasetsart J. (Nat. Sci.) 40(1)<br />
RESULTS AND DISCUSSION<br />
Chemical composition of crop residue and<br />
selected roughage<br />
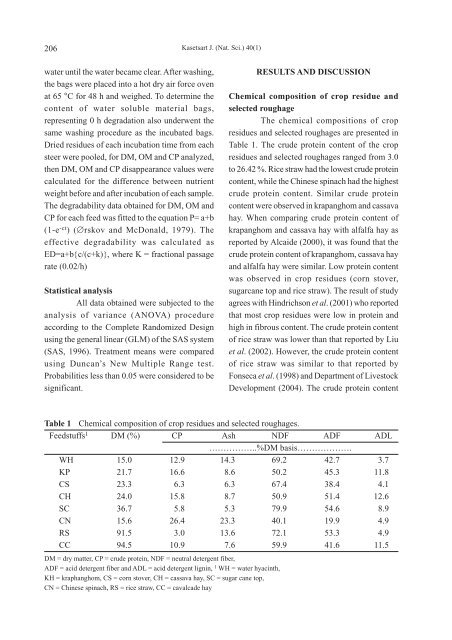
The chemical compositions of crop<br />
residues and selected roughages are presented in<br />
Table 1. The crude protein content of the crop<br />
residues and selected roughages ranged from 3.0<br />
to 26.42 %. Rice straw had the lowest crude protein<br />
content, while the Chinese spinach had the highest<br />
crude protein content. Similar crude protein<br />
content were observed in krapanghom and cassava<br />
hay. When comparing crude protein content of<br />
krapanghom and cassava hay with alfalfa hay as<br />
reported by Alcaide (2000), it was found that the<br />
crude protein content of krapanghom, cassava hay<br />
and alfalfa hay were similar. Low protein content<br />
was observed in crop residues (corn stover,<br />
sugarcane top and rice straw). The result of study<br />
agrees with Hindrichson et al. (2001) who reported<br />
that most crop residues were low in protein and<br />
high in fibrous content. The crude protein content<br />
of rice straw was lower than that reported by Liu<br />
et al. (2002). However, the crude protein content<br />
of rice straw was similar to that reported by<br />
Fonseca et al. (1998) and Department of Livestock<br />
Development (2004). The crude protein content<br />
Table 1 Chemical composition of crop residues and selected roughages.<br />
Feedstuffs 1 DM (%) CP Ash NDF ADF ADL<br />
……………..%DM basis……………….<br />
WH 15.0 12.9 14.3 69.2 42.7 3.7<br />
KP 21.7 16.6 8.6 50.2 45.3 11.8<br />
CS 23.3 6.3 6.3 67.4 38.4 4.1<br />
CH 24.0 15.8 8.7 50.9 51.4 12.6<br />
SC 36.7 5.8 5.3 79.9 54.6 8.9<br />
CN 15.6 26.4 23.3 40.1 19.9 4.9<br />
RS 91.5 3.0 13.6 72.1 53.3 4.9<br />
CC 94.5 10.9 7.6 59.9 41.6 11.5<br />
DM = dry matter, CP = crude protein, NDF = neutral detergent fiber,<br />
ADF = acid detergent fiber and ADL = acid detergent lignin, 1 WH = water hyacinth,<br />
KH = kraphanghom, CS = corn stover, CH = cassava hay, SC = sugar cane top,<br />
CN = Chinese spinach, RS = rice straw, CC = cavalcade hay