
You also want an ePaper? Increase the reach of your titles
YUMPU automatically turns print PDFs into web optimized ePapers that Google loves.
22<br />
measured to define fruit shape in terms of<br />
quantitative character. It was obvious from the<br />
generation mean comparison that P 1 and P 2 had<br />
the lowest and the highest index values of 1.2<br />
and 4.20, respectively. The narrow sense<br />
heritability determined for this character was as<br />
high as 0.55. The genetic gain of conducting mass<br />
selection at ten percent for this character was<br />
estimated at 0.71.<br />
Fruit weight The marketable fruit of<br />
cylindrical shape in P 2 parent made the highest<br />
fruit weight of 102.03 g. While the fruit of round<br />
shape in P 1 parent produced lower fruit weight at<br />
70.13 g and it was not statistically different from<br />
its F 1, F 2, and BC 1. The narrow sense heritability<br />
determined for fruit weight was as high as 0.71.<br />
The genetic gain of conducting mass selection at<br />
ten percent for this character was estimated at<br />
16.74 (Table 1).<br />
Fruit number per plant F 1 generation<br />
had the best performance considered from fruit<br />
number per plant, followed by that of BC 2, whereas<br />
the poorest performance was P 1. The narrow sense<br />
heritability examined for this character was as high<br />
as 0.60. The genetic gain when conducting mass<br />
Kasetsart J. (Nat. Sci.) 40(1)<br />
selection at ten percent was estimated at 9.06 fruit<br />
per plant.<br />
Yield per plant P 2 parent gave the best<br />
performance for yield per plant (2.62 kg), followed<br />
by that of first filial (2.19 kg), whereas the P 1<br />
parent yield was the lowest (1.42 kg).The narrow<br />
sense heritability evaluated for this character was<br />
as high as 0.61. Thus the genetic gain of<br />
conducting mass selection at ten percents was<br />
estimated at 0.75 (Table 1).<br />
The narrow sense heritability estimated<br />
of fruit width, fruit length, fruit shape, and fruit<br />
weight were high (55-71%). This study gave the<br />
similar results of Lippert and Hall (1982) who<br />
suggested that heritabilities of fruit diameter, fruit<br />
length, fruit shape index, and fruit weight in<br />
muskmelon were relatively high (53-71%).<br />
When, Kalb and Davis (1984) estimated moderate<br />
heritability for fruit weight and shape index in<br />
bush muskmelon (23 and 36%, respectively).<br />
Pornsuriya (2005) discovered that the cylindrical<br />
fruit shape was incompletely dominant to<br />
round fruit and this character was governed by a<br />
single gene.<br />
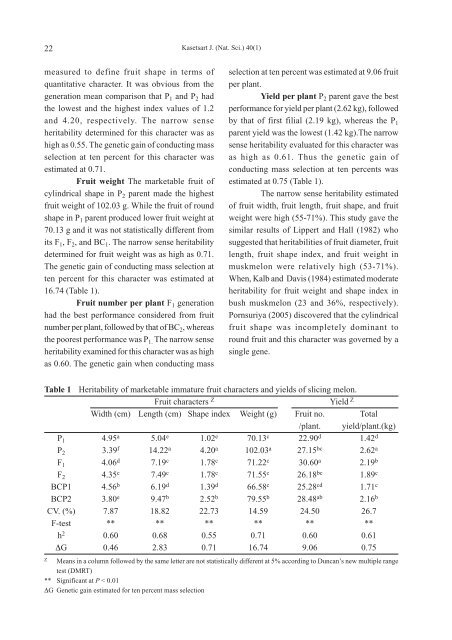
Table 1 Heritability of marketable immature fruit characters and yields of slicing melon.<br />
Fruit characters Z Yield Z<br />
Width (cm) Length (cm) Shape index Weight (g) Fruit no. Total<br />
/plant. yield/plant.(kg)<br />
P1 4.95a 5.04e 1.02e 70.13c 22.90d 1.42d P2 3.39f 14.22a 4.20a 102.03a 27.15bc 2.62a F1 4.06d 7.19c 1.78c 71.22c 30.60a 2.19b F2 4.35c 7.49c 1.78c 71.55c 26.18bc 1.89c BCP1 4.56b 6.19d 1.39d 66.58c 25.28cd 1.71c BCP2 3.80e 9.47b 2.52b 79.55b 28.48ab 2.16b CV. (%) 7.87 18.82 22.73 14.59 24.50 26.7<br />
F-test ** ** ** ** ** **<br />
h2 0.60 0.68 0.55 0.71 0.60 0.61<br />
∆G 0.46 2.83 0.71 16.74 9.06 0.75<br />
Z Means in a column followed by the same letter are not statistically different at 5% according to Duncan’s new multiple range<br />
test (DMRT)<br />
** Significant at P < 0.01<br />
∆G Genetic gain estimated for ten percent mass selection