
You also want an ePaper? Increase the reach of your titles
YUMPU automatically turns print PDFs into web optimized ePapers that Google loves.
266<br />
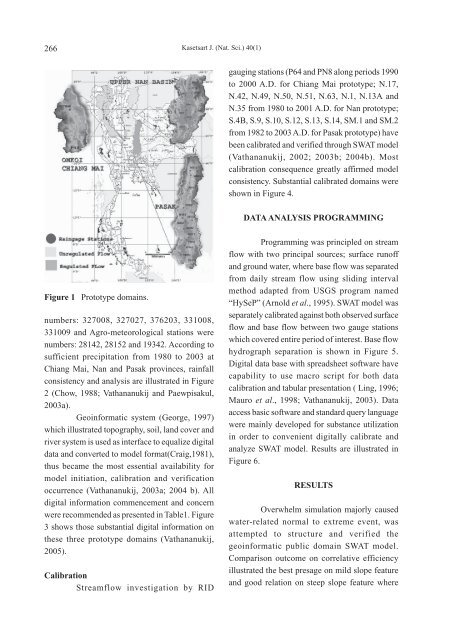
Figure 1 Prototype domains.<br />
numbers: 327008, 327027, 376203, 331008,<br />
331009 and Agro-meteorological stations were<br />
numbers: 28142, 28152 and 19342. According to<br />
sufficient precipitation from 1980 to 2003 at<br />
Chiang Mai, Nan and Pasak provinces, rainfall<br />
consistency and analysis are illustrated in Figure<br />
2 (Chow, 1988; Vathananukij and Paewpisakul,<br />
2003a).<br />
Geoinformatic system (George, 1997)<br />
which illustrated topography, soil, land cover and<br />
river system is used as interface to equalize digital<br />
data and converted to model format(Craig,1981),<br />
thus became the most essential availability for<br />
model initiation, calibration and verification<br />
occurrence (Vathananukij, 2003a; 2004 b). All<br />
digital information commencement and concern<br />
were recommended as presented in Table1. Figure<br />
3 shows those substantial digital information on<br />
these three prototype domains (Vathananukij,<br />
2005).<br />
Calibration<br />
Streamflow investigation by RID<br />
Kasetsart J. (Nat. Sci.) 40(1)<br />
gauging stations (P64 and PN8 along periods 1990<br />
to 2000 A.D. for Chiang Mai prototype; N.17,<br />
N.42, N.49, N.50, N.51, N.63, N.1, N.13A and<br />
N.35 from 1980 to 2001 A.D. for Nan prototype;<br />
S.4B, S.9, S.10, S.12, S.13, S.14, SM.1 and SM.2<br />
from 1982 to 2003 A.D. for Pasak prototype) have<br />
been calibrated and verified through SWAT model<br />
(Vathananukij, 2002; 2003b; 2004b). Most<br />
calibration consequence greatly affirmed model<br />
consistency. Substantial calibrated domains were<br />
shown in Figure 4.<br />
DATA ANALYSIS PROGRAMMING<br />
Programming was principled on stream<br />
flow with two principal sources; surface runoff<br />
and ground water, where base flow was separated<br />
from daily stream flow using sliding interval<br />
method adapted from USGS program named<br />
“HySeP” (Arnold et al., 1995). SWAT model was<br />
separately calibrated against both observed surface<br />
flow and base flow between two gauge stations<br />
which covered entire period of interest. Base flow<br />
hydrograph separation is shown in Figure 5.<br />
Digital data base with spreadsheet software have<br />
capability to use macro script for both data<br />
calibration and tabular presentation ( Ling, 1996;<br />
Mauro et al., 1998; Vathananukij, 2003). Data<br />
access basic software and standard query language<br />
were mainly developed for substance utilization<br />
in order to convenient digitally calibrate and<br />
analyze SWAT model. Results are illustrated in<br />
Figure 6.<br />
RESULTS<br />
Overwhelm simulation majorly caused<br />
water-related normal to extreme event, was<br />
attempted to structure and verified the<br />
geoinformatic public domain SWAT model.<br />
Comparison outcome on correlative efficiency<br />
illustrated the best presage on mild slope feature<br />
and good relation on steep slope feature where