
You also want an ePaper? Increase the reach of your titles
YUMPU automatically turns print PDFs into web optimized ePapers that Google loves.
RESULTS AND DISCUSSION<br />
In this paper, the product design of puffed<br />
snacks for a target consumer group would be<br />
presented only.<br />
1. Collecting data<br />
1.1 Preference data<br />
For puffed snacks, the respondents could<br />
be clustered into 2 different groups. The first group<br />
preferred puffed snacks 1 rather than puffed snacks<br />
2 and puffed snacks 3 and the second group was<br />
vice versa. Only the first group data is shown in<br />
Table1 and presented in this paper. The overall<br />
liking equation under Table 1 showed that the<br />
overall liking scores for this target group were<br />
highly affected by taste liking scores and<br />
moderately affected by texture and aroma liking<br />
scores. This result seemed to be agreed with<br />
Williams (1999) who mentioned that flavours<br />
and seasonings were very important for snack<br />
products.<br />
1.2 QDA data<br />
Semi-trained panelists generated 29<br />
QDA attributes for describing the sensory<br />
characteristics of 7 snack categories but the<br />
number of attributes used for each snack were<br />
different, such as there were 14 QDA attributes<br />
for puffed snacks. The QDA results showed that<br />
puffed snacks 1 were a bit milder in flavours and<br />
saltiness than puffed snacks 2 and both of them<br />
Kasetsart J. (Nat. Sci.) 40(1) 235<br />
were significantly stronger in flavours and<br />
saltiness than puffed snacks 3. In addition, puffed<br />
snacks 1 were a bit hotter than puffed snacks 2<br />
and both of them were significantly hotter than<br />
puffed snacks 3, whilst puffed snacks 2 and puffed<br />
snacks 3 were significantly sweeter, harder, and<br />
more cohesive than puffed snacks 1 (Figure 1).<br />
2. Quality function deployment<br />
The HOQ for puffed snacks (Figure 2)<br />
shows that the important quantitative descriptive<br />
attributes for puffed snacks were flavour both<br />
potato and seasoning flavours (7.65), saltiness and<br />
sweetness (6.12), cohesiveness of mass (1.71),<br />
hotness (0.68), and hardness (0.19), respectively.<br />
Clearly, the consumers wanted puffed snacks that<br />
were more flavoured (positive correlation<br />
coefficient) and had a lower potato flavour<br />
(negative correlation coefficient) in the case of<br />
aroma liking. However, the care for flovour was<br />
needed as the results showed that there was a<br />
particular optimum flavour, and that if the flavour<br />
was increased or decreased from this level, then<br />
consumer acceptance would decrease, i.e., the<br />
graph produced an inverted U-shaped curve for<br />
taste liking. The product needed to be less sweet,<br />
less cohesive, rather hot, and not hard, and the care<br />
for saltiness was needed as this attribute also<br />
showed an inverted U-shape when liking plotted<br />
against intensity. This finding was agreed with<br />
Booth and Conner (1990) and Moskowitz and<br />
Bernstein (2000) who mentioned that factors or<br />
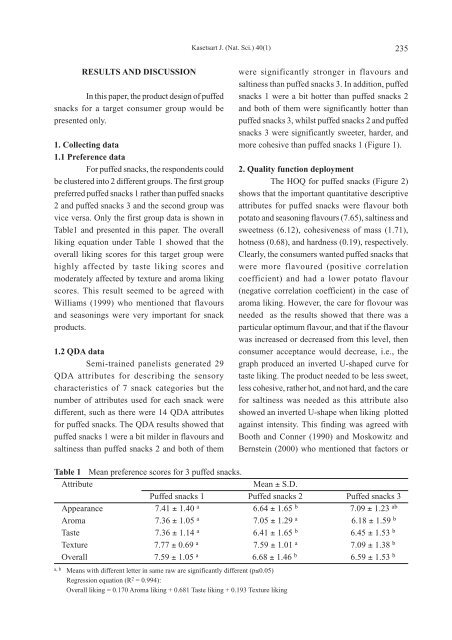
Table 1 Mean preference scores for 3 puffed snacks.<br />
Attribute Mean ± S.D.<br />
Puffed snacks 1 Puffed snacks 2 Puffed snacks 3<br />
Appearance 7.41 ± 1.40 a 6.64 ± 1.65 b 7.09 ± 1.23 ab<br />
Aroma 7.36 ± 1.05 a 7.05 ± 1.29 a 6.18 ± 1.59 b<br />
Taste 7.36 ± 1.14 a 6.41 ± 1.65 b 6.45 ± 1.53 b<br />
Texture 7.77 ± 0.69 a 7.59 ± 1.01 a 7.09 ± 1.38 b<br />
Overall 7.59 ± 1.05 a 6.68 ± 1.46 b 6.59 ± 1.53 b<br />
a, b Means with different letter in same raw are significantly different (p≤0.05)<br />
Regression equation (R2 = 0.994):<br />
Overall liking = 0.170 Aroma liking + 0.681 Taste liking + 0.193 Texture liking