Growing Together: Economic Integration for an Inclusive and - escap
Growing Together: Economic Integration for an Inclusive and - escap
Growing Together: Economic Integration for an Inclusive and - escap
Create successful ePaper yourself
Turn your PDF publications into a flip-book with our unique Google optimized e-Paper software.
141<br />
Annex<br />
Technical notes<br />
ii. Export opportunities indicator<br />
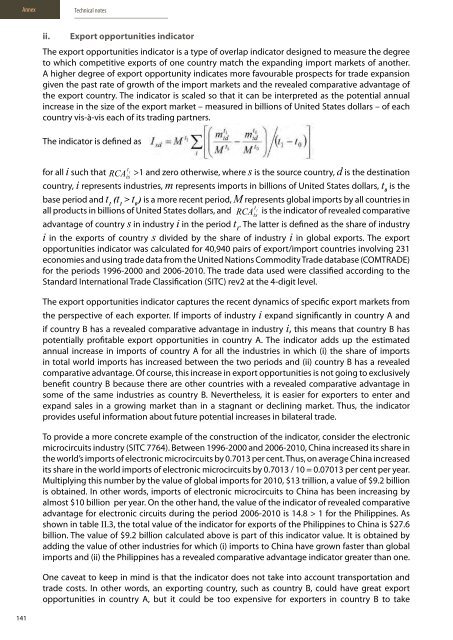
The export opportunities indicator is a type of overlap indicator designed to measure the degree<br />
to which competitive exports of one country match the exp<strong>an</strong>ding import markets of <strong>an</strong>other.<br />
A higher degree of export opportunity indicates more favourable prospects <strong>for</strong> trade exp<strong>an</strong>sion<br />
given the past rate of growth of the import markets <strong>an</strong>d the revealed comparative adv<strong>an</strong>tage of<br />
the export country. The indicator is scaled so that it c<strong>an</strong> be interpreted as the potential <strong>an</strong>nual<br />
increase in the size of the export market – measured in billions of United States dollars – of each<br />
country vis-à-vis each of its trading partners.<br />
The indicator is defined as<br />
<strong>for</strong> all i such that >1 <strong>an</strong>d zero otherwise, where s is the source country, d is the destination<br />
RCA t 1<br />
is<br />
country, i represents industries, m represents imports in billions of United States dollars, t is the 0<br />
base period <strong>an</strong>d t (t > t ) is a more recent period, M represents global imports by all countries in<br />
1 1 0<br />
all products in billions of United States dollars, <strong>an</strong>d RCA is the indicator of revealed comparative<br />
adv<strong>an</strong>tage of country s in industry i in the period t . The latter is defined as the share of industry<br />
1<br />
i in the exports of country s divided by the share of industry i in global exports. The export<br />
opportunities indicator was calculated <strong>for</strong> 40,940 pairs of export/import countries involving 231<br />
economies <strong>an</strong>d using trade data from the United Nations Commodity Trade database (COMTRADE)<br />
<strong>for</strong> the periods 1996-2000 <strong>an</strong>d 2006-2010. The trade data used were classified according to the<br />
St<strong>an</strong>dard International Trade Classification (SITC) rev2 at the 4-digit level.<br />
t1 is<br />
The export opportunities indicator captures the recent dynamics of specific export markets from<br />
the perspective of each exporter. If imports of industry i exp<strong>an</strong>d signific<strong>an</strong>tly in country A <strong>an</strong>d<br />
if country B has a revealed comparative adv<strong>an</strong>tage in industry i, this me<strong>an</strong>s that country B has<br />
potentially profitable export opportunities in country A. The indicator adds up the estimated<br />
<strong>an</strong>nual increase in imports of country A <strong>for</strong> all the industries in which (i) the share of imports<br />
in total world imports has increased between the two periods <strong>an</strong>d (ii) country B has a revealed<br />
comparative adv<strong>an</strong>tage. Of course, this increase in export opportunities is not going to exclusively<br />
benefit country B because there are other countries with a revealed comparative adv<strong>an</strong>tage in<br />
some of the same industries as country B. Nevertheless, it is easier <strong>for</strong> exporters to enter <strong>an</strong>d<br />
exp<strong>an</strong>d sales in a growing market th<strong>an</strong> in a stagn<strong>an</strong>t or declining market. Thus, the indicator<br />
provides useful in<strong>for</strong>mation about future potential increases in bilateral trade.<br />
To provide a more concrete example of the construction of the indicator, consider the electronic<br />
microcircuits industry (SITC 7764). Between 1996-2000 <strong>an</strong>d 2006-2010, China increased its share in<br />
the world’s imports of electronic microcircuits by 0.7013 per cent. Thus, on average China increased<br />
its share in the world imports of electronic microcircuits by 0.7013 / 10 = 0.07013 per cent per year.<br />
Multiplying this number by the value of global imports <strong>for</strong> 2010, $13 trillion, a value of $9.2 billion<br />
is obtained. In other words, imports of electronic microcircuits to China has been increasing by<br />
almost $10 billion per year. On the other h<strong>an</strong>d, the value of the indicator of revealed comparative<br />
adv<strong>an</strong>tage <strong>for</strong> electronic circuits during the period 2006-2010 is 14.8 > 1 <strong>for</strong> the Philippines. As<br />
shown in table II.3, the total value of the indicator <strong>for</strong> exports of the Philippines to China is $27.6<br />
billion. The value of $9.2 billion calculated above is part of this indicator value. It is obtained by<br />
adding the value of other industries <strong>for</strong> which (i) imports to China have grown faster th<strong>an</strong> global<br />
imports <strong>an</strong>d (ii) the Philippines has a revealed comparative adv<strong>an</strong>tage indicator greater th<strong>an</strong> one.<br />
One caveat to keep in mind is that the indicator does not take into account tr<strong>an</strong>sportation <strong>an</strong>d<br />
trade costs. In other words, <strong>an</strong> exporting country, such as country B, could have great export<br />
opportunities in country A, but it could be too expensive <strong>for</strong> exporters in country B to take


