Growing Together: Economic Integration for an Inclusive and - escap
Growing Together: Economic Integration for an Inclusive and - escap
Growing Together: Economic Integration for an Inclusive and - escap

Create successful ePaper yourself
Turn your PDF publications into a flip-book with our unique Google optimized e-Paper software.
eing located at a long dist<strong>an</strong>ce from the fastgrowing<br />
economies in the rest of the region.<br />
Because of their remoteness, relatively small<br />
populations <strong>an</strong>d low trading volumes, it is<br />
difficult <strong>for</strong> shipping comp<strong>an</strong>ies to maintain<br />
regular services to them.<br />
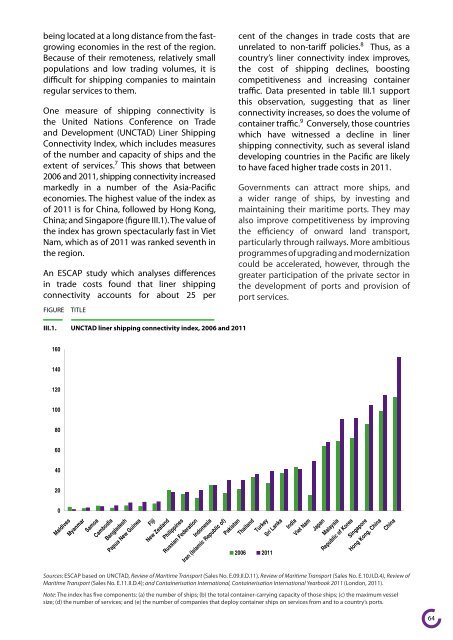
One measure of shipping connectivity is<br />
the United Nations Conference on Trade<br />
<strong>an</strong>d Development (UNCTAD) Liner Shipping<br />
Connectivity Index, which includes measures<br />
of the number <strong>an</strong>d capacity of ships <strong>an</strong>d the<br />
extent of services. 7 This shows that between<br />
2006 <strong>an</strong>d 2011, shipping connectivity increased<br />
markedly in a number of the Asia-Pacific<br />
economies. The highest value of the index as<br />
of 2011 is <strong>for</strong> China, followed by Hong Kong,<br />
China; <strong>an</strong>d Singapore (figure III.1). The value of<br />
the index has grown spectacularly fast in Viet<br />
Nam, which as of 2011 was r<strong>an</strong>ked seventh in<br />
the region.<br />
An ESCAP study which <strong>an</strong>alyses differences<br />
in trade costs found that liner shipping<br />
connectivity accounts <strong>for</strong> about 25 per<br />
FIGURE TITLE<br />
III.1. UNCTAD liner shipping connectivity index, 2006 <strong>an</strong>d 2011<br />
160<br />
140<br />
120<br />
100<br />
80<br />
60<br />
40<br />
20<br />
0<br />
Maldives<br />
My<strong>an</strong>mar<br />
Samoa<br />
Cambodia<br />
B<strong>an</strong>gladesh<br />
cent of the ch<strong>an</strong>ges in trade costs that are<br />
unrelated to non-tariff policies. 8 Thus, as a<br />
country’s liner connectivity index improves,<br />
the cost of shipping declines, boosting<br />
competitiveness <strong>an</strong>d increasing container<br />
traffic. Data presented in table III.1 support<br />
this observation, suggesting that as liner<br />
connectivity increases, so does the volume of<br />
container traffic. 9 Conversely, those countries<br />
which have witnessed a decline in liner<br />
shipping connectivity, such as several isl<strong>an</strong>d<br />
developing countries in the Pacific are likely<br />
to have faced higher trade costs in 2011.<br />
Governments c<strong>an</strong> attract more ships, <strong>an</strong>d<br />
a wider r<strong>an</strong>ge of ships, by investing <strong>an</strong>d<br />
maintaining their maritime ports. They may<br />
also improve competitiveness by improving<br />
the efficiency of onward l<strong>an</strong>d tr<strong>an</strong>sport,<br />
particularly through railways. More ambitious<br />
programmes of upgrading <strong>an</strong>d modernization<br />
could be accelerated, however, through the<br />
greater participation of the private sector in<br />
the development of ports <strong>an</strong>d provision of<br />
port services.<br />
2006 2011<br />
Papua New Guinea<br />
Fiji<br />
New Zeal<strong>an</strong>d<br />
Philippines<br />
Russi<strong>an</strong> Federation<br />
Indonesia<br />
Ir<strong>an</strong> (Islamic Republic of)<br />
Pakist<strong>an</strong><br />
Thail<strong>an</strong>d<br />
Turkey<br />
Sri L<strong>an</strong>ka<br />
India<br />
Viet Nam<br />
Jap<strong>an</strong><br />
Malaysia<br />
Republic of Korea<br />
Singapore<br />
Hong Kong, China<br />
China<br />
Sources: ESCAP based on UNCTAD, Review of Maritime Tr<strong>an</strong>sport (Sales No. E.09.II.D.11), Review of Maritime Tr<strong>an</strong>sport (Sales No. E.10.II.D.4), Review of<br />
Maritime Tr<strong>an</strong>sport (Sales No. E.11.II.D.4); <strong>an</strong>d Containerisation International, Containerisation International Yearbook 2011 (London, 2011).<br />
Note: The index has five components: (a) the number of ships; (b) the total container-carrying capacity of those ships; (c) the maximum vessel<br />
size; (d) the number of services; <strong>an</strong>d (e) the number of comp<strong>an</strong>ies that deploy container ships on services from <strong>an</strong>d to a country’s ports.<br />
64