Growing Together: Economic Integration for an Inclusive and - escap
Growing Together: Economic Integration for an Inclusive and - escap
Growing Together: Economic Integration for an Inclusive and - escap

You also want an ePaper? Increase the reach of your titles
YUMPU automatically turns print PDFs into web optimized ePapers that Google loves.
TABLE TITLE<br />
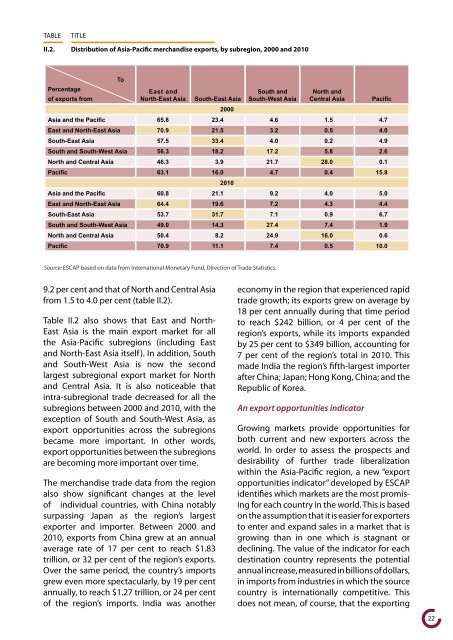
II.2. Distribution of Asia-Pacific merch<strong>an</strong>dise exports, by subregion, 2000 <strong>an</strong>d 2010<br />
Percentage<br />
of exports from<br />
To<br />
East <strong>an</strong>d<br />
North-East Asia South-East Asia<br />
2000<br />
South <strong>an</strong>d<br />
South-West Asia<br />
Source: ESCAP based on data from International Monetary Fund, Direction of Trade Statistics.<br />
North <strong>an</strong>d<br />
Central Asia Pacific<br />
Asia <strong>an</strong>d the Pacific 65.8 23.4 4.6 1.5 4.7<br />
East <strong>an</strong>d North-East Asia 70.9 21.5 3.2 0.5 4.0<br />
South-East Asia 57.5 33.4 4.0 0.2 4.9<br />
South <strong>an</strong>d South-West Asia 56.3 18.2 17.2 5.8 2.6<br />
North <strong>an</strong>d Central Asia 46.3 3.9 21.7 28.0 0.1<br />
Pacific 63.1 16.0<br />
2010<br />
4.7 0.4 15.8<br />
Asia <strong>an</strong>d the Pacific 60.8 21.1 9.2 4.0 5.0<br />
East <strong>an</strong>d North-East Asia 64.4 19.6 7.2 4.3 4.4<br />
South-East Asia 53.7 31.7 7.1 0.9 6.7<br />
South <strong>an</strong>d South-West Asia 49.0 14.3 27.4 7.4 1.9<br />
North <strong>an</strong>d Central Asia 50.4 8.2 24.9 16.0 0.6<br />
Pacific 70.9 11.1 7.4 0.5 10.0<br />
9.2 per cent <strong>an</strong>d that of North <strong>an</strong>d Central Asia<br />
from 1.5 to 4.0 per cent (table II.2).<br />
Table II.2 also shows that East <strong>an</strong>d North-<br />
East Asia is the main export market <strong>for</strong> all<br />
the Asia-Pacific subregions (including East<br />
<strong>an</strong>d North-East Asia itself). In addition, South<br />
<strong>an</strong>d South-West Asia is now the second<br />
largest subregional export market <strong>for</strong> North<br />
<strong>an</strong>d Central Asia. It is also noticeable that<br />
intra-subregional trade decreased <strong>for</strong> all the<br />
subregions between 2000 <strong>an</strong>d 2010, with the<br />
exception of South <strong>an</strong>d South-West Asia, as<br />
export opportunities across the subregions<br />
became more import<strong>an</strong>t. In other words,<br />
export opportunities between the subregions<br />
are becoming more import<strong>an</strong>t over time.<br />
The merch<strong>an</strong>dise trade data from the region<br />
also show signific<strong>an</strong>t ch<strong>an</strong>ges at the level<br />
of individual countries, with China notably<br />
surpassing Jap<strong>an</strong> as the region’s largest<br />
exporter <strong>an</strong>d importer. Between 2000 <strong>an</strong>d<br />
2010, exports from China grew at <strong>an</strong> <strong>an</strong>nual<br />
average rate of 17 per cent to reach $1.83<br />
trillion, or 32 per cent of the region’s exports.<br />
Over the same period, the country’s imports<br />
grew even more spectacularly, by 19 per cent<br />
<strong>an</strong>nually, to reach $1.27 trillion, or 24 per cent<br />
of the region’s imports. India was <strong>an</strong>other<br />
economy in the region that experienced rapid<br />
trade growth; its exports grew on average by<br />
18 per cent <strong>an</strong>nually during that time period<br />
to reach $242 billion, or 4 per cent of the<br />
region’s exports, while its imports exp<strong>an</strong>ded<br />
by 25 per cent to $349 billion, accounting <strong>for</strong><br />
7 per cent of the region’s total in 2010. This<br />
made India the region’s fifth-largest importer<br />
after China; Jap<strong>an</strong>; Hong Kong, China; <strong>an</strong>d the<br />
Republic of Korea.<br />
An export opportunities indicator<br />
<strong>Growing</strong> markets provide opportunities <strong>for</strong><br />
both current <strong>an</strong>d new exporters across the<br />
world. In order to assess the prospects <strong>an</strong>d<br />
desirability of further trade liberalization<br />
within the Asia-Pacific region, a new “export<br />
opportunities indicator” developed by ESCAP<br />
identifies which markets are the most promising<br />
<strong>for</strong> each country in the world. This is based<br />
on the assumption that it is easier <strong>for</strong> exporters<br />
to enter <strong>an</strong>d exp<strong>an</strong>d sales in a market that is<br />
growing th<strong>an</strong> in one which is stagn<strong>an</strong>t or<br />
declining. The value of the indicator <strong>for</strong> each<br />
destination country represents the potential<br />
<strong>an</strong>nual increase, measured in billions of dollars,<br />
in imports from industries in which the source<br />
country is internationally competitive. This<br />
does not me<strong>an</strong>, of course, that the exporting<br />
22