Growing Together: Economic Integration for an Inclusive and - escap
Growing Together: Economic Integration for an Inclusive and - escap
Growing Together: Economic Integration for an Inclusive and - escap

Create successful ePaper yourself
Turn your PDF publications into a flip-book with our unique Google optimized e-Paper software.
CHAPTER ONE<br />
11<br />
The case <strong>for</strong> regional economic integration in Asia <strong>an</strong>d the Pacific<br />
inflows has been confirmed in a number of<br />
qu<strong>an</strong>titative studies. 37 Mexico also benefited<br />
from lower volatility in its growth rate <strong>an</strong>d<br />
a subst<strong>an</strong>tial improvement in total factor<br />
productivity. 38<br />
Even more import<strong>an</strong>t th<strong>an</strong> providing larger<br />
markets, RTAs help strengthen overall<br />
competitiveness by enabling intraregional FDI<br />
to achieve extensive industrial restructuring<br />
or rationalization. There<strong>for</strong>e, most RTAs now<br />
extend their scope beyond trade to include<br />
investment liberalization <strong>an</strong>d facilitation.<br />
This me<strong>an</strong>s, <strong>for</strong> example, that multinational<br />
enterprises (MNEs) no longer need to<br />
maintain horizontal national operations<br />
<strong>an</strong>d instead c<strong>an</strong> assign the responsibility<br />
<strong>for</strong> serving specific regional or even global<br />
markets in particular products to certain<br />
affiliates to harness economies of scale <strong>an</strong>d<br />
specialization – a strategy sometimes called<br />
”product m<strong>an</strong>dating”. 39<br />
Deeper integration encourages industries<br />
to migrate to low-wage locations to the<br />
adv<strong>an</strong>tage of the lesser developed economies.<br />
In the EU the poorer members have benefited<br />
from resource tr<strong>an</strong>sfers, but they have<br />
also gained signific<strong>an</strong>tly from industrial<br />
restructuring. For inst<strong>an</strong>ce, after joining the<br />
Europe<strong>an</strong> <strong>Economic</strong> Community in 1973,<br />
Irel<strong>an</strong>d increased its per capita income from<br />
59 per cent of the Europe<strong>an</strong> average to over<br />
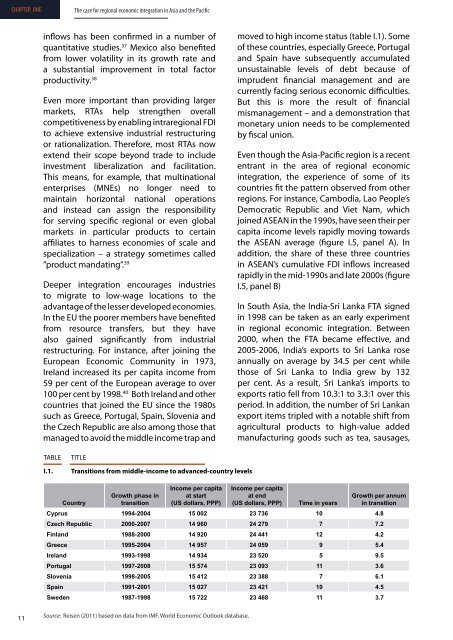
100 per cent by 1998. 40 Both Irel<strong>an</strong>d <strong>an</strong>d other<br />
countries that joined the EU since the 1980s<br />
such as Greece, Portugal, Spain, Slovenia <strong>an</strong>d<br />
the Czech Republic are also among those that<br />
m<strong>an</strong>aged to avoid the middle income trap <strong>an</strong>d<br />
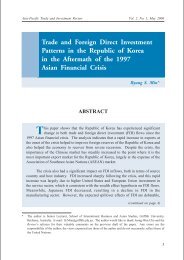
TABLE TITLE<br />
I.1. Tr<strong>an</strong>sitions from middle-income to adv<strong>an</strong>ced-country levels<br />
moved to high income status (table I.1). Some<br />
of these countries, especially Greece, Portugal<br />
<strong>an</strong>d Spain have subsequently accumulated<br />
unsustainable levels of debt because of<br />
imprudent fin<strong>an</strong>cial m<strong>an</strong>agement <strong>an</strong>d are<br />
currently facing serious economic difficulties.<br />
But this is more the result of fin<strong>an</strong>cial<br />
mism<strong>an</strong>agement – <strong>an</strong>d a demonstration that<br />
monetary union needs to be complemented<br />
by fiscal union.<br />
Even though the Asia-Pacific region is a recent<br />
entr<strong>an</strong>t in the area of regional economic<br />
integration, the experience of some of its<br />
countries fit the pattern observed from other<br />
regions. For inst<strong>an</strong>ce, Cambodia, Lao People’s<br />
Democratic Republic <strong>an</strong>d Viet Nam, which<br />
joined ASEAN in the 1990s, have seen their per<br />
capita income levels rapidly moving towards<br />
the ASEAN average (figure I.5, p<strong>an</strong>el A). In<br />
addition, the share of these three countries<br />
in ASEAN’s cumulative FDI inflows increased<br />
rapidly in the mid-1990s <strong>an</strong>d late 2000s (figure<br />
I.5, p<strong>an</strong>el B)<br />
In South Asia, the India-Sri L<strong>an</strong>ka FTA signed<br />
in 1998 c<strong>an</strong> be taken as <strong>an</strong> early experiment<br />
in regional economic integration. Between<br />
2000, when the FTA became effective, <strong>an</strong>d<br />
2005-2006, India’s exports to Sri L<strong>an</strong>ka rose<br />
<strong>an</strong>nually on average by 34.5 per cent while<br />
those of Sri L<strong>an</strong>ka to India grew by 132<br />
per cent. As a result, Sri L<strong>an</strong>ka’s imports to<br />
exports ratio fell from 10.3:1 to 3.3:1 over this<br />
period. In addition, the number of Sri L<strong>an</strong>k<strong>an</strong><br />
export items tripled with a notable shift from<br />
agricultural products to high-value added<br />
m<strong>an</strong>ufacturing goods such as tea, sausages,<br />
Income per capita Income per capita<br />
Growth phase in at start<br />
at end<br />
Growth per <strong>an</strong>num<br />
Country<br />
tr<strong>an</strong>sition (US dollars, PPP) (US dollars, PPP) Time in years in tr<strong>an</strong>sition<br />
Cyprus 1994-2004 15 002 23 736 10 4.8<br />
Czech Republic 2000-2007 14 960 24 279 7 7.2<br />
Finl<strong>an</strong>d 1988-2000 14 920 24 441 12 4.2<br />
Greece 1995-2004 14 957 24 059 9 5.4<br />
Irel<strong>an</strong>d 1993-1998 14 934 23 520 5 9.5<br />
Portugal 1997-2008 15 574 23 093 11 3.6<br />
Slovenia 1998-2005 15 412 23 388 7 6.1<br />
Spain 1991-2001 15 027 23 421 10 4.5<br />
Sweden 1987-1998 15 722 23 468 11 3.7<br />
Source: Reisen (2011) based on data from IMF, World <strong>Economic</strong> Outlook database.