Growing Together: Economic Integration for an Inclusive and - escap
Growing Together: Economic Integration for an Inclusive and - escap
Growing Together: Economic Integration for an Inclusive and - escap

Create successful ePaper yourself
Turn your PDF publications into a flip-book with our unique Google optimized e-Paper software.
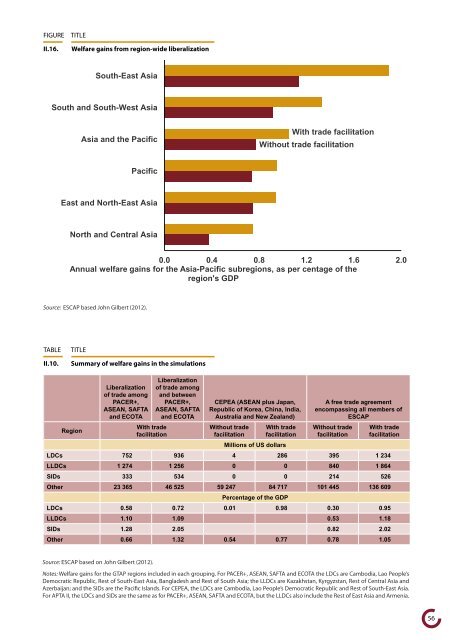
FIGURE TITLE<br />
II.16. Welfare gains from region-wide liberalization<br />
Source: ESCAP based John Gilbert (2012).<br />
TABLE TITLE<br />
II.10. Summary of welfare gains in the simulations<br />
Region<br />
South-East Asia<br />
South <strong>an</strong>d South-West Asia<br />
Asia <strong>an</strong>d the Pacific<br />
Pacific<br />
East <strong>an</strong>d North-East Asia<br />
North <strong>an</strong>d Central Asia<br />
0.0 0.4 0.8 1.2 1.6 2.0<br />
Annual welfare gains <strong>for</strong> the Asia-Pacific subregions, as per centage of the<br />
region's GDP<br />
Liberalization<br />
of trade among<br />
PACER+,<br />
ASEAN, SAFTA<br />
<strong>an</strong>d ECOTA<br />
With trade<br />
facilitation<br />
Liberalization<br />
of trade among<br />
<strong>an</strong>d between<br />
PACER+,<br />
ASEAN, SAFTA<br />
<strong>an</strong>d ECOTA<br />
CEPEA (ASEAN plus Jap<strong>an</strong>,<br />
Republic of Korea, China, India,<br />
Australia <strong>an</strong>d New Zeal<strong>an</strong>d)<br />
Without trade<br />
facilitation<br />
With trade facilitation<br />
Without trade facilitation<br />
With trade<br />
facilitation<br />
A free trade agreement<br />
encompassing all members of<br />
ESCAP<br />
Without trade<br />
facilitation<br />
With trade<br />
facilitation<br />
Millions of US dollars<br />
LDCs 752 936 4 286 395 1 234<br />
LLDCs 1 274 1 256 0 0 840 1 864<br />
SIDs 333 534 0 0 214 526<br />
Other 23 365 46 525 59 247 84 717 101 445 136 609<br />
Percentage of the GDP<br />
LDCs 0.58 0.72 0.01 0.98 0.30 0.95<br />
LLDCs 1.10 1.09 0.53 1.18<br />
SIDs 1.28 2.05 0.82 2.02<br />
Other 0.66 1.32 0.54 0.77 0.78 1.05<br />
Source: ESCAP based on John Gilbert (2012).<br />
Notes: Welfare gains <strong>for</strong> the GTAP regions included in each grouping. For PACER+, ASEAN, SAFTA <strong>an</strong>d ECOTA the LDCs are Cambodia, Lao People’s<br />
Democratic Republic, Rest of South-East Asia, B<strong>an</strong>gladesh <strong>an</strong>d Rest of South Asia; the LLDCs are Kazakhst<strong>an</strong>, Kyrgyzst<strong>an</strong>, Rest of Central Asia <strong>an</strong>d<br />
Azerbaij<strong>an</strong>; <strong>an</strong>d the SIDs are the Pacific Isl<strong>an</strong>ds. For CEPEA, the LDCs are Cambodia, Lao People’s Democratic Republic <strong>an</strong>d Rest of South-East Asia.<br />
For APTA II, the LDCs <strong>an</strong>d SIDs are the same as <strong>for</strong> PACER+, ASEAN, SAFTA <strong>an</strong>d ECOTA, but the LLDCs also include the Rest of East Asia <strong>an</strong>d Armenia.<br />
56