Growing Together: Economic Integration for an Inclusive and - escap
Growing Together: Economic Integration for an Inclusive and - escap
Growing Together: Economic Integration for an Inclusive and - escap

Create successful ePaper yourself
Turn your PDF publications into a flip-book with our unique Google optimized e-Paper software.
a greater pace, <strong>an</strong>d thus could make a large<br />
contribution to supporting growth across the<br />
region.<br />
Education services<br />
Exports of education services, especially at<br />
the tertiary level, have increasingly become<br />
<strong>an</strong> import<strong>an</strong>t source of <strong>for</strong>eign exch<strong>an</strong>ge<br />
earnings <strong>for</strong> m<strong>an</strong>y Asia-Pacific economies.<br />
According to data from the United Nations<br />
Educational, Scientific <strong>an</strong>d Cultural Org<strong>an</strong>ization<br />
(UNESCO) Institute <strong>for</strong> Statistics, the<br />
three largest education services exporters of<br />
the region are Australia, Jap<strong>an</strong>, <strong>an</strong>d the Russi<strong>an</strong><br />
Federation. As it is clear from figure II.8, the<br />
large majority of international students in the<br />
Asia-Pacific economies come from other Asia-<br />
Pacific economies.<br />
However, statistics on the number of<br />
international students only partially capture<br />
trade in education services. Education<br />
services provided to international students<br />
are classified, according to the General<br />
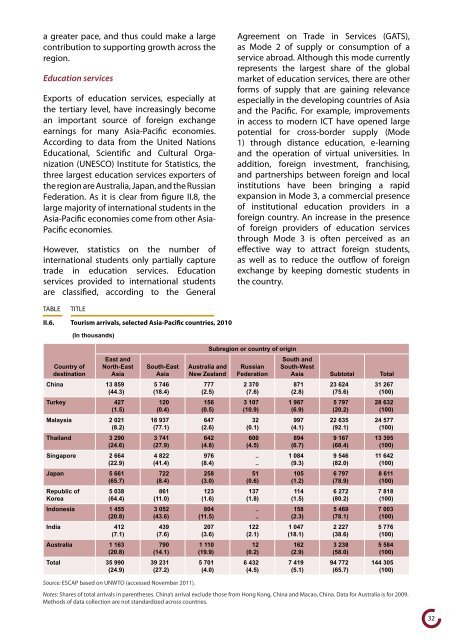
TABLE TITLE<br />
II.6. Tourism arrivals, selected Asia-Pacific countries, 2010<br />
Country of<br />
destination<br />
East <strong>an</strong>d<br />
North-East<br />
Asia<br />
China 13 859<br />
(44.3)<br />
Turkey 427<br />
(1.5)<br />
Malaysia 2 021<br />
(8.2)<br />
Thail<strong>an</strong>d 3 290<br />
(24.6)<br />
Singapore 2 664<br />
(22.9)<br />
Jap<strong>an</strong> 5 661<br />
(65.7)<br />
Republic of<br />
Korea<br />
(In thous<strong>an</strong>ds)<br />
5 038<br />
(64.4)<br />
Indonesia 1 455<br />
(20.8)<br />
India 412<br />
(7.1)<br />
Australia 1 163<br />
(20.8)<br />
Total 35 990<br />
(24.9)<br />
South-East<br />
Asia<br />
5 746<br />
(18.4)<br />
120<br />
(0.4)<br />
18 937<br />
(77.1)<br />
3 741<br />
(27.9)<br />
4 822<br />
(41.4)<br />
722<br />
(8.4)<br />
861<br />
(11.0)<br />
3 052<br />
(43.6)<br />
439<br />
(7.6)<br />
790<br />
(14.1)<br />
39 231<br />
(27.2)<br />
Australia <strong>an</strong>d<br />
New Zeal<strong>an</strong>d<br />
777<br />
(2.5)<br />
156<br />
(0.5)<br />
647<br />
(2.6)<br />
642<br />
(4.8)<br />
976<br />
(8.4)<br />
258<br />
(3.0)<br />
123<br />
(1.6)<br />
804<br />
(11.5)<br />
207<br />
(3.6)<br />
1 110<br />
(19.9)<br />
5 701<br />
(4.0)<br />
Agreement on Trade in Services (GATS),<br />
as Mode 2 of supply or consumption of a<br />
service abroad. Although this mode currently<br />
represents the largest share of the global<br />
market of education services, there are other<br />
<strong>for</strong>ms of supply that are gaining relev<strong>an</strong>ce<br />
especially in the developing countries of Asia<br />
<strong>an</strong>d the Pacific. For example, improvements<br />
in access to modern ICT have opened large<br />
potential <strong>for</strong> cross-border supply (Mode<br />
1) through dist<strong>an</strong>ce education, e-learning<br />
<strong>an</strong>d the operation of virtual universities. In<br />
addition, <strong>for</strong>eign investment, fr<strong>an</strong>chising,<br />
<strong>an</strong>d partnerships between <strong>for</strong>eign <strong>an</strong>d local<br />
institutions have been bringing a rapid<br />
exp<strong>an</strong>sion in Mode 3, a commercial presence<br />
of institutional education providers in a<br />
<strong>for</strong>eign country. An increase in the presence<br />
of <strong>for</strong>eign providers of education services<br />
through Mode 3 is often perceived as <strong>an</strong><br />
effective way to attract <strong>for</strong>eign students,<br />
as well as to reduce the outflow of <strong>for</strong>eign<br />
exch<strong>an</strong>ge by keeping domestic students in<br />
the country.<br />
Subregion or country of origin<br />
Russi<strong>an</strong><br />
Federation<br />
2 370<br />
(7.6)<br />
3 107<br />
(10.9)<br />
32<br />
(0.1)<br />
600<br />
(4.5)<br />
..<br />
..<br />
51<br />
(0.6)<br />
137<br />
(1.8)<br />
..<br />
..<br />
122<br />
(2.1)<br />
12<br />
(0.2)<br />
6 432<br />
(4.5)<br />
South <strong>an</strong>d<br />
South-West<br />
Asia Subtotal Total<br />
871<br />
(2.8)<br />
1 987<br />
(6.9)<br />
997<br />
(4.1)<br />
894<br />
(6.7)<br />
1 084<br />
(9.3)<br />
105<br />
(1.2)<br />
114<br />
(1.5)<br />
158<br />
(2.3)<br />
1 047<br />
(18.1)<br />
162<br />
(2.9)<br />
7 419<br />
(5.1)<br />
23 624<br />
(75.6)<br />
5 797<br />
(20.2)<br />
22 635<br />
(92.1)<br />
9 167<br />
(68.4)<br />
9 546<br />
(82.0)<br />
6 797<br />
(78.9)<br />
6 272<br />
(80.2)<br />
5 469<br />
(78.1)<br />
2 227<br />
(38.6)<br />
3 238<br />
(58.0)<br />
94 772<br />
(65.7)<br />
31 267<br />
(100)<br />
28 632<br />
(100)<br />
24 577<br />
(100)<br />
13 395<br />
(100)<br />
11 642<br />
(100)<br />
8 611<br />
(100)<br />
7 818<br />
(100)<br />
7 003<br />
(100)<br />
5 776<br />
(100)<br />
5 584<br />
(100)<br />
144 305<br />
(100)<br />
Source: ESCAP based on UNWTO (accessed November 2011).<br />
Notes: Shares of total arrivals in parentheses. China’s arrival exclude those from Hong Kong, China <strong>an</strong>d Macao, China. Data <strong>for</strong> Australia is <strong>for</strong> 2009.<br />
Methods of data collection are not st<strong>an</strong>dardized across countries.<br />
32