Growing Together: Economic Integration for an Inclusive and - escap
Growing Together: Economic Integration for an Inclusive and - escap
Growing Together: Economic Integration for an Inclusive and - escap

You also want an ePaper? Increase the reach of your titles
YUMPU automatically turns print PDFs into web optimized ePapers that Google loves.
FIGURE TITLE<br />
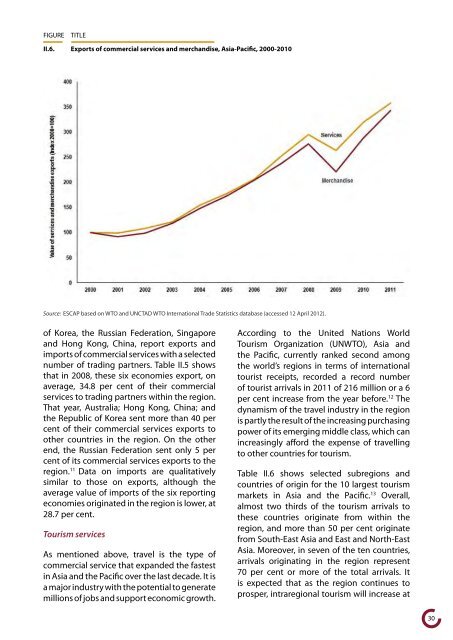
II.6. Exports of commercial services <strong>an</strong>d merch<strong>an</strong>dise, Asia-Pacific, 2000-2010<br />
Source: ESCAP based on WTO <strong>an</strong>d UNCTAD WTO International Trade Statistics database (accessed 12 April 2012).<br />
of Korea, the Russi<strong>an</strong> Federation, Singapore<br />
<strong>an</strong>d Hong Kong, China, report exports <strong>an</strong>d<br />
imports of commercial services with a selected<br />
number of trading partners. Table II.5 shows<br />
that in 2008, these six economies export, on<br />
average, 34.8 per cent of their commercial<br />
services to trading partners within the region.<br />
That year, Australia; Hong Kong, China; <strong>an</strong>d<br />
the Republic of Korea sent more th<strong>an</strong> 40 per<br />
cent of their commercial services exports to<br />
other countries in the region. On the other<br />
end, the Russi<strong>an</strong> Federation sent only 5 per<br />
cent of its commercial services exports to the<br />
region. 11 Data on imports are qualitatively<br />
similar to those on exports, although the<br />
average value of imports of the six reporting<br />
economies originated in the region is lower, at<br />
28.7 per cent.<br />
Tourism services<br />
As mentioned above, travel is the type of<br />
commercial service that exp<strong>an</strong>ded the fastest<br />
in Asia <strong>an</strong>d the Pacific over the last decade. It is<br />
a major industry with the potential to generate<br />
millions of jobs <strong>an</strong>d support economic growth.<br />
According to the United Nations World<br />
Tourism Org<strong>an</strong>ization (UNWTO), Asia <strong>an</strong>d<br />
the Pacific, currently r<strong>an</strong>ked second among<br />
the world’s regions in terms of international<br />
tourist receipts, recorded a record number<br />
of tourist arrivals in 2011 of 216 million or a 6<br />
per cent increase from the year be<strong>for</strong>e. 12 The<br />
dynamism of the travel industry in the region<br />
is partly the result of the increasing purchasing<br />
power of its emerging middle class, which c<strong>an</strong><br />
increasingly af<strong>for</strong>d the expense of travelling<br />
to other countries <strong>for</strong> tourism.<br />
Table II.6 shows selected subregions <strong>an</strong>d<br />
countries of origin <strong>for</strong> the 10 largest tourism<br />
markets in Asia <strong>an</strong>d the Pacific. 13 Overall,<br />
almost two thirds of the tourism arrivals to<br />
these countries originate from within the<br />
region, <strong>an</strong>d more th<strong>an</strong> 50 per cent originate<br />
from South-East Asia <strong>an</strong>d East <strong>an</strong>d North-East<br />
Asia. Moreover, in seven of the ten countries,<br />
arrivals originating in the region represent<br />
70 per cent or more of the total arrivals. It<br />
is expected that as the region continues to<br />
prosper, intraregional tourism will increase at<br />
30