Growing Together: Economic Integration for an Inclusive and - escap
Growing Together: Economic Integration for an Inclusive and - escap
Growing Together: Economic Integration for an Inclusive and - escap
You also want an ePaper? Increase the reach of your titles
YUMPU automatically turns print PDFs into web optimized ePapers that Google loves.
CHAPTER TWO<br />
57<br />
Towards a broader integrated market<br />
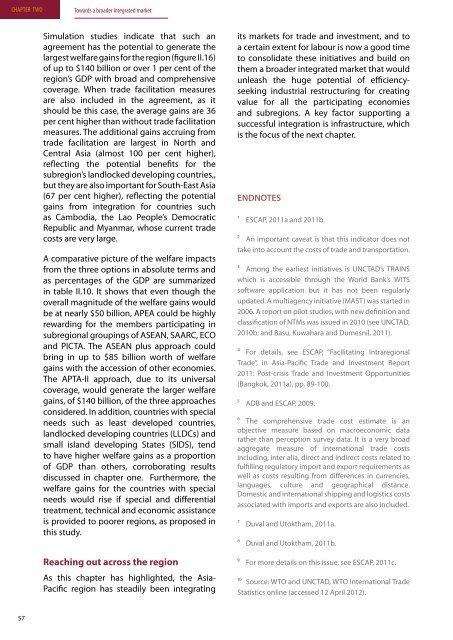
Simulation studies indicate that such <strong>an</strong><br />
agreement has the potential to generate the<br />
largest welfare gains <strong>for</strong> the region (figure II.16)<br />
of up to $140 billion or over 1 per cent of the<br />
region’s GDP with broad <strong>an</strong>d comprehensive<br />
coverage. When trade facilitation measures<br />
are also included in the agreement, as it<br />
should be this case, the average gains are 36<br />
per cent higher th<strong>an</strong> without trade facilitation<br />
measures. The additional gains accruing from<br />
trade facilitation are largest in North <strong>an</strong>d<br />
Central Asia (almost 100 per cent higher),<br />
reflecting the potential benefits <strong>for</strong> the<br />
subregion’s l<strong>an</strong>dlocked developing countries,,<br />
but they are also import<strong>an</strong>t <strong>for</strong> South-East Asia<br />
(67 per cent higher), reflecting the potential<br />
gains from integration <strong>for</strong> countries such<br />
as Cambodia, the Lao People’s Democratic<br />
Republic <strong>an</strong>d My<strong>an</strong>mar, whose current trade<br />
costs are very large.<br />
A comparative picture of the welfare impacts<br />
from the three options in absolute terms <strong>an</strong>d<br />
as percentages of the GDP are summarized<br />
in table II.10. It shows that even though the<br />
overall magnitude of the welfare gains would<br />
be at nearly $50 billion, APEA could be highly<br />
rewarding <strong>for</strong> the members participating in<br />
subregional groupings of ASEAN, SAARC, ECO<br />
<strong>an</strong>d PICTA. The ASEAN plus approach could<br />
bring in up to $85 billion worth of welfare<br />
gains with the accession of other economies.<br />
The APTA-II approach, due to its universal<br />
coverage, would generate the larger welfare<br />
gains, of $140 billion, of the three approaches<br />
considered. In addition, countries with special<br />
needs such as least developed countries,<br />
l<strong>an</strong>dlocked developing countries (LLDCs) <strong>an</strong>d<br />
small isl<strong>an</strong>d developing States (SIDS), tend<br />
to have higher welfare gains as a proportion<br />
of GDP th<strong>an</strong> others, corroborating results<br />
discussed in chapter one. Furthermore, the<br />
welfare gains <strong>for</strong> the countries with special<br />
needs would rise if special <strong>an</strong>d differential<br />
treatment, technical <strong>an</strong>d economic assist<strong>an</strong>ce<br />
is provided to poorer regions, as proposed in<br />
this study.<br />
Reaching out across the region<br />
As this chapter has highlighted, the Asia-<br />
Pacific region has steadily been integrating<br />
its markets <strong>for</strong> trade <strong>an</strong>d investment, <strong>an</strong>d to<br />
a certain extent <strong>for</strong> labour is now a good time<br />
to consolidate these initiatives <strong>an</strong>d build on<br />
them a broader integrated market that would<br />
unleash the huge potential of efficiencyseeking<br />
industrial restructuring <strong>for</strong> creating<br />
value <strong>for</strong> all the participating economies<br />
<strong>an</strong>d subregions. A key factor supporting a<br />
successful integration is infrastructure, which<br />
is the focus of the next chapter.<br />
ENDNOTES<br />
1 ESCAP, 2011a <strong>an</strong>d 2011b.<br />
2 An import<strong>an</strong>t caveat is that this indicator does not<br />
take into account the costs of trade <strong>an</strong>d tr<strong>an</strong>sportation.<br />
3 Among the earliest initiatives is UNCTAD’s TRAINS<br />
which is accessible through the World B<strong>an</strong>k’s WITS<br />
software application but it has not been regularly<br />
updated. A multiagency initiative (MAST) was started in<br />
2006. A report on pilot studies, with new definition <strong>an</strong>d<br />
classification of NTMs was issued in 2010 (see UNCTAD,<br />
2010b; <strong>an</strong>d Basu, Kuwahara <strong>an</strong>d Dumesnil, 2011).<br />
4 For details, see ESCAP, “Facilitating Intraregional<br />
Trade”, in Asia-Pacific Trade <strong>an</strong>d Investment Report<br />
2011: Post-crisis Trade <strong>an</strong>d Investment Opportunities<br />
(B<strong>an</strong>gkok, 2011a), pp. 89-100.<br />
5 ADB <strong>an</strong>d ESCAP, 2009.<br />
6 The comprehensive trade cost estimate is <strong>an</strong><br />
objective measure based on macroeconomic data<br />
rather th<strong>an</strong> perception survey data. It is a very broad<br />
aggregate measure of international trade costs<br />
including, inter alia, direct <strong>an</strong>d indirect costs related to<br />
fulfilling regulatory import <strong>an</strong>d export requirements as<br />
well as costs resulting from differences in currencies,<br />
l<strong>an</strong>guages, culture <strong>an</strong>d geographical dist<strong>an</strong>ce.<br />
Domestic <strong>an</strong>d international shipping <strong>an</strong>d logistics costs<br />
associated with imports <strong>an</strong>d exports are also included.<br />
7 Duval <strong>an</strong>d Utoktham, 2011a.<br />
8 Duval <strong>an</strong>d Utoktham, 2011b.<br />
9 For more details on this issue, see ESCAP, 2011c.<br />
10 Source: WTO <strong>an</strong>d UNCTAD, WTO International Trade<br />
Statistics online (accessed 12 April 2012).


