Growing Together: Economic Integration for an Inclusive and - escap
Growing Together: Economic Integration for an Inclusive and - escap
Growing Together: Economic Integration for an Inclusive and - escap

Create successful ePaper yourself
Turn your PDF publications into a flip-book with our unique Google optimized e-Paper software.
country will necessarily be in a position to<br />
take adv<strong>an</strong>tage of all this market growth<br />
because other countries that export similar<br />
products will also try to take adv<strong>an</strong>tage of<br />
these emerging opportunities. Details on<br />
the methodology <strong>for</strong> the computation of the<br />
indicator are included in the <strong>an</strong>nex.<br />
The results of this <strong>an</strong>alysis are summarized in<br />
figure II.2, which shows the ten most promising<br />
export markets in the world <strong>for</strong> each country<br />
in Asia <strong>an</strong>d the Pacific. The results show that<br />
China is among the top 10 export markets<br />
in the world <strong>for</strong> all the countries in Asia <strong>an</strong>d<br />
the Pacific. Other top 10 export markets<br />
<strong>for</strong> countries in the region are India (<strong>for</strong> 44<br />
countries), Republic of Korea (<strong>for</strong> 39 countries),<br />
Russi<strong>an</strong> Federation (<strong>for</strong> 32 countries) <strong>an</strong>d<br />
Turkey (<strong>for</strong> 28 countries). Exports to China<br />
also provide the indicators with the largest<br />
values: export opportunities in China <strong>for</strong><br />
Jap<strong>an</strong>, <strong>for</strong> example, are growing by $35 billion<br />
a year, followed by those <strong>for</strong> the Republic of<br />
Korea at $29 billion. Nevertheless, China also<br />
offers import<strong>an</strong>t export opportunities to<br />
lower-income or less developed countries,<br />
including the Democratic People’s Republic<br />
of Korea, $16 billion, Papua New Guinea, $11<br />
billion, Mongolia, $8 billion, My<strong>an</strong>mar, $3.7<br />
billion, Lao People’s Democratic Republic,<br />
$3.4 billion, <strong>an</strong>d Nepal, $2.4 billion. The<br />
TABLE TITLE<br />
second most promising market <strong>for</strong> the Asia-<br />
Pacific exporters is India, which offers large<br />
opportunities <strong>for</strong> products from Georgia<br />
<strong>an</strong>d the Russi<strong>an</strong> Federation, both $8 billion,<br />
<strong>an</strong>d Kazakhst<strong>an</strong> <strong>an</strong>d Papua New Guinea,<br />
both $7 billion. For most countries the<br />
greatest opportunities lie outside their own<br />
subregions.<br />
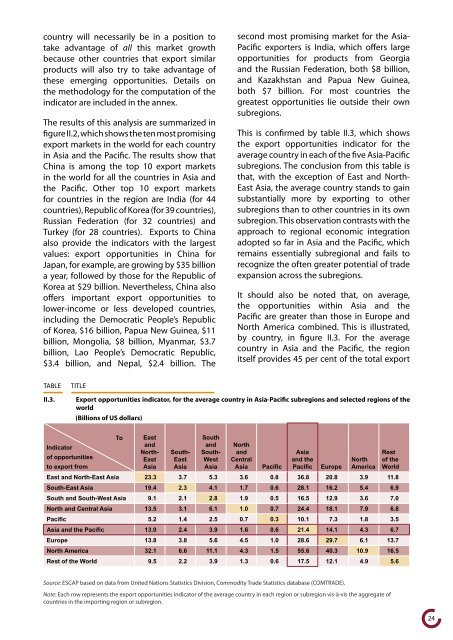
This is confirmed by table II.3, which shows<br />
the export opportunities indicator <strong>for</strong> the<br />
average country in each of the five Asia-Pacific<br />
subregions. The conclusion from this table is<br />
that, with the exception of East <strong>an</strong>d North-<br />
East Asia, the average country st<strong>an</strong>ds to gain<br />
subst<strong>an</strong>tially more by exporting to other<br />
subregions th<strong>an</strong> to other countries in its own<br />
subregion. This observation contrasts with the<br />
approach to regional economic integration<br />
adopted so far in Asia <strong>an</strong>d the Pacific, which<br />
remains essentially subregional <strong>an</strong>d fails to<br />
recognize the often greater potential of trade<br />
exp<strong>an</strong>sion across the subregions.<br />
It should also be noted that, on average,<br />
the opportunities within Asia <strong>an</strong>d the<br />
Pacific are greater th<strong>an</strong> those in Europe <strong>an</strong>d<br />
North America combined. This is illustrated,<br />
by country, in figure II.3. For the average<br />
country in Asia <strong>an</strong>d the Pacific, the region<br />
itself provides 45 per cent of the total export<br />
II.3. Export opportunities indicator, <strong>for</strong> the average country in Asia-Pacific subregions <strong>an</strong>d selected regions of the<br />
world<br />
(Billions of US dollars)<br />
To East<br />
South<br />
Indicator<br />
of opportunities<br />
<strong>an</strong>d<br />
North-<br />
East<br />
South-<br />
East<br />
<strong>an</strong>d<br />
South-<br />
West<br />
North<br />
<strong>an</strong>d<br />
Central<br />
Asia<br />
<strong>an</strong>d the<br />
North<br />
Rest<br />
of the<br />
to export from<br />
Asia Asia Asia Asia Pacific Pacific Europe America World<br />
East <strong>an</strong>d North-East Asia 23.3 3.7 5.3 3.6 0.8 36.8 20.8 3.9 11.8<br />
South-East Asia 19.4 2.3 4.1 1.7 0.6 28.1 16.2 5.4 6.9<br />
South <strong>an</strong>d South-West Asia 9.1 2.1 2.8 1.9 0.5 16.5 12.9 3.6 7.0<br />
North <strong>an</strong>d Central Asia 13.5 3.1 6.1 1.0 0.7 24.4 18.1 7.9 6.8<br />
Pacific 5.2 1.4 2.5 0.7 0.3 10.1 7.3 1.8 3.5<br />
Asia <strong>an</strong>d the Pacific 13.0 2.4 3.9 1.6 0.6 21.4 14.1 4.3 6.7<br />
Europe 13.8 3.8 5.6 4.5 1.0 28.6 29.7 6.1 13.7<br />
North America 32.1 6.6 11.1 4.3 1.5 55.6 40.3 10.9 16.5<br />
Rest of the World 9.5 2.2 3.9 1.3 0.6 17.5 12.1 4.9 5.6<br />
Source: ESCAP based on data from United Nations Statistics Division, Commodity Trade Statistics database (COMTRADE).<br />
Note: Each row represents the export opportunities indicator of the average country in each region or subregion vis-à-vis the aggregate of<br />
countries in the importing region or subregion.<br />
24