Growing Together: Economic Integration for an Inclusive and - escap
Growing Together: Economic Integration for an Inclusive and - escap
Growing Together: Economic Integration for an Inclusive and - escap

You also want an ePaper? Increase the reach of your titles
YUMPU automatically turns print PDFs into web optimized ePapers that Google loves.
Research undertaken by ESCAP suggests<br />
that tariff trade costs in Asia <strong>an</strong>d the Pacific<br />
generally account <strong>for</strong> up to 10 per cent of<br />
bilateral comprehensive trade costs, while<br />
other policy-related trade costs, such those of a<br />
non-tariff nature, account <strong>for</strong> 60 to 90 per cent.<br />
Natural trade costs vary widely depending on<br />
the partner countries, but account on average<br />
<strong>for</strong> more th<strong>an</strong> 20 per cent of trade costs. As<br />
indicated in figure II.4, progress to bring down<br />
trade costs will be particularly import<strong>an</strong>t in<br />
maritime services <strong>an</strong>d in in<strong>for</strong>mation <strong>an</strong>d<br />
communications technology (ICT).<br />
It should be noted, too, that the full costs lay<br />
not so much in the direct costs of completing<br />
the procedures, but in a potential reluct<strong>an</strong>ce<br />
to engage in trade if the likely overall costs are<br />
uncertain.<br />
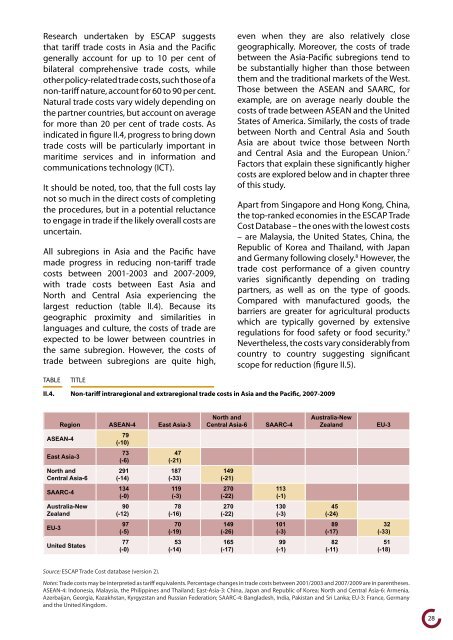
All subregions in Asia <strong>an</strong>d the Pacific have<br />
made progress in reducing non-tariff trade<br />
costs between 2001-2003 <strong>an</strong>d 2007-2009,<br />
with trade costs between East Asia <strong>an</strong>d<br />
North <strong>an</strong>d Central Asia experiencing the<br />
largest reduction (table II.4). Because its<br />
geographic proximity <strong>an</strong>d similarities in<br />
l<strong>an</strong>guages <strong>an</strong>d culture, the costs of trade are<br />
expected to be lower between countries in<br />
the same subregion. However, the costs of<br />
trade between subregions are quite high,<br />
TABLE TITLE<br />
even when they are also relatively close<br />
geographically. Moreover, the costs of trade<br />
between the Asia-Pacific subregions tend to<br />
be subst<strong>an</strong>tially higher th<strong>an</strong> those between<br />
them <strong>an</strong>d the traditional markets of the West.<br />
Those between the ASEAN <strong>an</strong>d SAARC, <strong>for</strong><br />
example, are on average nearly double the<br />
costs of trade between ASEAN <strong>an</strong>d the United<br />
States of America. Similarly, the costs of trade<br />
between North <strong>an</strong>d Central Asia <strong>an</strong>d South<br />
Asia are about twice those between North<br />
<strong>an</strong>d Central Asia <strong>an</strong>d the Europe<strong>an</strong> Union. 7<br />
Factors that explain these signific<strong>an</strong>tly higher<br />
costs are explored below <strong>an</strong>d in chapter three<br />
of this study.<br />
Apart from Singapore <strong>an</strong>d Hong Kong, China,<br />
the top-r<strong>an</strong>ked economies in the ESCAP Trade<br />
Cost Database – the ones with the lowest costs<br />
– are Malaysia, the United States, China, the<br />
Republic of Korea <strong>an</strong>d Thail<strong>an</strong>d, with Jap<strong>an</strong><br />
<strong>an</strong>d Germ<strong>an</strong>y following closely. 8 However, the<br />
trade cost per<strong>for</strong>m<strong>an</strong>ce of a given country<br />
varies signific<strong>an</strong>tly depending on trading<br />
partners, as well as on the type of goods.<br />
Compared with m<strong>an</strong>ufactured goods, the<br />
barriers are greater <strong>for</strong> agricultural products<br />
which are typically governed by extensive<br />
regulations <strong>for</strong> food safety or food security. 9<br />
Nevertheless, the costs vary considerably from<br />
country to country suggesting signific<strong>an</strong>t<br />
scope <strong>for</strong> reduction (figure II.5).<br />
II.4. Non-tariff intraregional <strong>an</strong>d extraregional trade costs in Asia <strong>an</strong>d the Pacific, 2007-2009<br />
Region ASEAN-4 East Asia-3<br />
ASEAN-4<br />
79<br />
(-10)<br />
East Asia-3<br />
73<br />
(-6)<br />
47<br />
(-21)<br />
North <strong>an</strong>d<br />
291<br />
187<br />
Central Asia-6 (-14)<br />
(-33)<br />
SAARC-4<br />
134<br />
(-0)<br />
119<br />
(-3)<br />
Australia-New<br />
90<br />
78<br />
Zeal<strong>an</strong>d<br />
(-12)<br />
(-16)<br />
EU-3<br />
97<br />
(-5)<br />
70<br />
(-19)<br />
United States<br />
77<br />
(-0)<br />
53<br />
(-14)<br />
North <strong>an</strong>d<br />
Central Asia-6 SAARC-4<br />
149<br />
(-21)<br />
270<br />
(-22)<br />
270<br />
(-22)<br />
149<br />
(-26)<br />
165<br />
(-17)<br />
Australia-New<br />
Zeal<strong>an</strong>d EU-3<br />
Source: ESCAP Trade Cost database (version 2).<br />
Notes: Trade costs may be interpreted as tariff equivalents. Percentage ch<strong>an</strong>ges in trade costs between 2001/2003 <strong>an</strong>d 2007/2009 are in parentheses.<br />
ASEAN-4: Indonesia, Malaysia, the Philippines <strong>an</strong>d Thail<strong>an</strong>d; East-Asia-3: China, Jap<strong>an</strong> <strong>an</strong>d Republic of Korea; North <strong>an</strong>d Central Asia-6: Armenia,<br />
Azerbaij<strong>an</strong>, Georgia, Kazakhst<strong>an</strong>, Kyrgyzst<strong>an</strong> <strong>an</strong>d Russi<strong>an</strong> Federation; SAARC-4: B<strong>an</strong>gladesh, India, Pakist<strong>an</strong> <strong>an</strong>d Sri L<strong>an</strong>ka; EU-3: Fr<strong>an</strong>ce, Germ<strong>an</strong>y<br />
<strong>an</strong>d the United Kingdom.<br />
113<br />
(-1)<br />
130<br />
(-3)<br />
101<br />
(-3)<br />
99<br />
(-1)<br />
45<br />
(-24)<br />
89<br />
(-17)<br />
82<br />
(-11)<br />
32<br />
(-33)<br />
51<br />
(-18)<br />
28