- Page 3 and 4:
Encuesta Demográfica y de Salud Fa
- Page 5:
PREPARACIÓN DEL INFORME PROGRAMA M
- Page 8 and 9:
Intenciones de uso en el futuro ...
- Page 10 and 11:
Lista de Cuadros CAPÍTULO 1: CARAC
- Page 12 and 13:
Cuadro 6.11 Planificación de la fe
- Page 14 and 15:
Lista de Gráficos CAPÍTULO 1: CAR
- Page 17:
Presentación El Instituto Nacional
- Page 20 and 21:
ESTIMACIONES MUESTRALES INDICADORES
- Page 22 and 23:
puntos porcentuales en relación a
- Page 24 and 25:
encuentra el DIU de 9,1 a 3,8 por c
- Page 26 and 27:
nacimientos no deseados pudiesen se
- Page 28 and 29:
En cuanto a la percepción de la ma
- Page 30 and 31:
La desnutrición crónica afectó a
- Page 32 and 33:
ciento de ellas, fueron obligadas a
- Page 34 and 35:
ENERGÍA ELÉCTRICA FUENTE DE AGUA
- Page 36 and 37:
Cuadro 1.1.1 Características de la
- Page 38 and 39:
Cuadros 1.2.1 y 1.2.2 Bienes de con
- Page 40 and 41:
países que han participado en la c
- Page 42 and 43:
Cuadro 1.4 Población de los hogare
- Page 44 and 45:
esidencia, esta proporción fue may
- Page 46 and 47:
Cuadro 1.7 Orfandad de los niños,
- Page 48 and 49:
Cuadro 1.8.1 Nivel de educación de
- Page 50 and 51:
Asistencia escolar por edad • Dur
- Page 52 and 53:
Cuadro 2.1 Características de las
- Page 54 and 55:
Cuadro 2.2 Nivel de educación de l
- Page 56 and 57:
Cuadro 2.4 Alfabetismo de las mujer
- Page 58 and 59:
Cuadro 2.5 Acceso de las mujeres a
- Page 60 and 61:
Cuadro 2.6 Trabajo en los últimos
- Page 62 and 63:
Cuadro 2.7 Tipo de ocupación de la
- Page 64 and 65:
Cuadro 2.8 Empleador y forma de rem
- Page 66 and 67:
• Según lugar de residencia, las
- Page 68 and 69:
Cuadro 2.11 Última palabra en deci
- Page 70 and 71:
• Las MEF con seguro de ESSALUD,
- Page 72 and 73:
Cuadro 2.13 Cobertura de seguro de
- Page 74 and 75:
Cuadro 2.14 Conocimiento y actitude
- Page 76 and 77:
74 Encuesta Demográfica y de Salud
- Page 78 and 79:
Niveles de fecundidad Cuadro 3.1
- Page 80:
• Las mujeres del área rural tie
- Page 83 and 84:
TOTAL ÁREA DE RESIDENCIA Urbana Ru
- Page 85 and 86:
3.2 FECUNDIDAD ACUMULADA En esta se
- Page 87 and 88:
Cuadro 3.7 Intervalo entre nacimien
- Page 89 and 90:
Cuadro 3.9 Mediana de edad al prime
- Page 91 and 92:
Cuadro 3.10 y Gráfico 3.4 • •
- Page 93 and 94:
• Entre las mujeres no unidas con
- Page 95 and 96:
4.2 USO DE MÉTODOS Con el objeto d
- Page 97 and 98:
Prevalencia actual del uso de méto
- Page 99 and 100:
• Entre la ENDES 2000 y la ENDES
- Page 101 and 102:
Cuadro 4.5.1 Uso actual de métodos
- Page 103 and 104:
Cuadro 4.6 Cambios en la mezcla de
- Page 105 and 106:
Edad al momento de la esterilizaci
- Page 107 and 108:
Cuadro 4.10 Fuente de suministro de
- Page 109 and 110:
4.3 DISCONTINUACIÓN DEL USO DE MÉ
- Page 111 and 112:
Intenciones de uso en el futuro A l
- Page 113 and 114:
4.4 MENSAJES SOBRE PLANIFICACIÓN F
- Page 115 and 116:
TOTAL ÁREA DE RESIDENCIA Urbana Ru
- Page 117 and 118:
En la ENDES Continua 2009 también
- Page 119 and 120:
116 Encuesta Demográfica y de Salu
- Page 121 and 122:
Cuadro 5.1 Estado conyugal actual d
- Page 123 and 124:
Cuadro 5.3 Estado conyugal actual d
- Page 125 and 126:
Cuadro 5.4 Tipo de compañero sexua
- Page 127 and 128:
Cuadro 5.6 Edad mediana a la primer
- Page 129 and 130:
5.3 EDAD A LA PRIMERA RELACIÓN SEX
- Page 131 and 132:
Cuadro 5.8 Edad mediana a la primer
- Page 133 and 134:
• Ciertamente, no es la situació
- Page 135 and 136:
ponderando el tiempo con la proporc
- Page 137 and 138:
5.6 EXPOSICIÓN AL RIESGO DE EMBARA
- Page 139 and 140:
dentro de los próximos dos años,
- Page 141 and 142:
La evolución entre la ENDES 1986 y
- Page 143 and 144:
Quienes no están en ninguna de est
- Page 145 and 146:
Cuadro 6.6 Necesidad de servicios d
- Page 147 and 148:
Usualmente existe una alta asociaci
- Page 149 and 150:
Cuadro 6.9 Promedio ideal de hijos,
- Page 151 and 152:
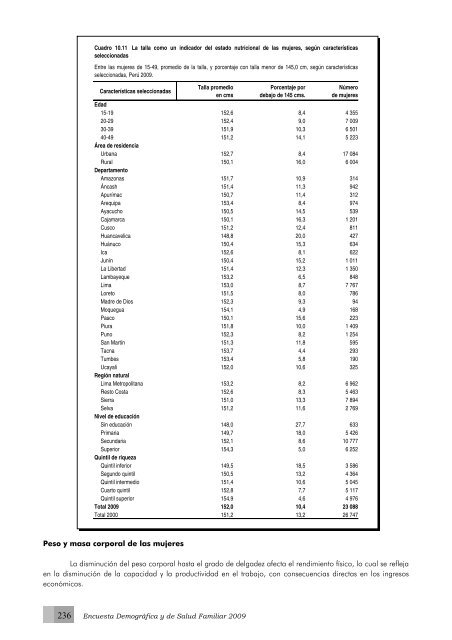
En el Cuadro 6.11 se presenta la di
- Page 153 and 154:
Cuadro 6.12 Fecundidad deseada y ob
- Page 155 and 156:
Especial atención debe prestarse a
- Page 157 and 158:
• El nivel educativo de la madre
- Page 159:
fecundidad y la mortalidad infantil
- Page 162 and 163:
Defunciones por mil nacidos vivos 7
- Page 164 and 165:
Cuadro 7.6 Tanto los nacidos muerto
- Page 166 and 167:
• El 63,4 por ciento de las mujer
- Page 168 and 169:
Estimación de la Mortalidad Adulta
- Page 170 and 171:
puede calcular la tasa de mortalida
- Page 172 and 173:
Atención prenatal por fuente de at
- Page 174:
Cuadros 8.2, 8.3 y Gráfico 8.1 Nú
- Page 177 and 178:
NÚMERO DE VISITAS Gráfico 8.1 Vis
- Page 179 and 180:
8.2 ATENCIÓN DEL PARTO Lugar de oc
- Page 181 and 182:
• Se resaltan diferencias de acue
- Page 183 and 184:
Cuadro 8.6 Atención durante el par
- Page 185 and 186:
constituye una situación en extrem
- Page 187 and 188:
Cuadros 8.8.1 y 8.8.2 Persona que p
- Page 189 and 190:
Cuadro 8.8.2 Proveedores de atenci
- Page 191 and 192:
Cuadro 8.9 Problemas en el acceso a
- Page 193:
Cuadro 9.1 Peso y tamaño al nacer
- Page 196: Vacunaciones por características s
- Page 199 and 200: Vacunaciones entre niñas y niños
- Page 201: Cuadro 9.5 Prevalencia y tratamient
- Page 204 and 205: Cuadro 9.6 Prevalencia y tratamient
- Page 206 and 207: Cuadro 9.7 Prevalencia de diarrea P
- Page 208 and 209: Cuadro 9.8 Tratamiento de la diarre
- Page 210 and 211: Cuadro 9.9 Prácticas de alimentaci
- Page 212 and 213: Cuadro 9.11 Eliminación de las dep
- Page 214 and 215: 206 Encuesta Demográfica y de Salu
- Page 216 and 217: • Los menores porcentajes de lact
- Page 218 and 219: 10.2 LACTANCIA Y ALIMENTACIÓN SUPL
- Page 220: 10.3 DURACIÓN DE LA LACTANCIA El C
- Page 223 and 224: 10.4 TIPO DE ALIMENTACIÓN COMPLEME
- Page 225 and 226: Frecuencia de comidas recibidas en
- Page 227 and 228: Micronutrientes (Cuadro 10.6 y 10.7
- Page 229 and 230: Cuadro 10.7 Ingesta de micronutrien
- Page 231: El nivel requerido de hemoglobina e
- Page 234 and 235: Cuadro 10.8.2 Pre valencia de anemi
- Page 236 and 237: 10.6 NUTRICIÓN DE NIÑAS Y NIÑOS
- Page 238 and 239: Desnutrición crónica según carac
- Page 240 and 241: Desnutrición global según grupos
- Page 242: Cuadro 10.9.2 Indicadores de desnut
- Page 245: La baja estatura materna está vinc
- Page 249 and 250: • Por departamento, San Martín y
- Page 251 and 252: 240 Encuesta Demográfica y de Salu
- Page 253 and 254: Conocimiento de VIH/SIDA (Cuadro 11
- Page 255 and 256: Gráfico 11.1 Conocimiento de forma
- Page 257 and 258: Urbana, en la Sierra y Selva, entre
- Page 259 and 260: Cuadro 11.3 Aspectos sociales de la
- Page 261 and 262: TOTAL ÁREA DE RESIDENCIA Urbana Ru
- Page 263 and 264: Cuadro 11.4 Conocimiento de los sí
- Page 265 and 266: 11.4 PREVALENCIA DE LAS INFECCIONES
- Page 267 and 268: Cuadro 11.6 Prevalencia de infeccio
- Page 269 and 270: 11.5 CONDUCTA SEXUAL, USO DEL COND
- Page 271 and 272: 11.8.1 Número de parejas sexuales
- Page 273 and 274: • Los datos presentes hacen notar
- Page 275 and 276: Cuadro 11.10 Uso de condón por tip
- Page 277 and 278: También se brinda información sob
- Page 279 and 280: Gráfico 12.1 Situaciones de contro
- Page 281 and 282: 12.2 VIOLENCIA FÍSICA CONTRA LA MU
- Page 283 and 284: Cuadro 12.2 Violencia intrafamiliar
- Page 285 and 286: Cuadro 12.3 • El 14,2 por ciento
- Page 287 and 288: Cuadro 12.4 • La quinta parte de
- Page 289 and 290: Cuadro 12.4 Violencia intrafamiliar
- Page 291 and 292: Cuadro 12.6. Violencia intrafamilia
- Page 293 and 294: Gráfico 12.3 Violencia fìsica por
- Page 295 and 296: Cuadro 12.8 La ENDES Continua 2009
- Page 297 and 298:
• Por área de residencia, el may
- Page 299 and 300:
Cuadro 12.10 Violencia intrafamilia
- Page 301 and 302:
Cuadro 12.12 Violencia intrafamilia
- Page 303 and 304:
292 Encuesta Demográfica y de Salu
- Page 305 and 306:
Entre las ventajas de esta aplicaci
- Page 307 and 308:
• El total de muestra estimado en
- Page 309 and 310:
• Se calcula el número de grupos
- Page 311 and 312:
Cuadro A.3 Implementación de la mu
- Page 313 and 314:
302 Encuesta Demográfica y de Salu
- Page 315 and 316:
en donde () ⎟ H mh 2 1− f m ⎛
- Page 317 and 318:
Cuadro B.1 Variables seleccionadas
- Page 319 and 320:
Cuadro B.2.1 Errores de muestreo pa
- Page 321 and 322:
Cuadro B.2.3 Errores de muestreo pa
- Page 323 and 324:
Cuadro B.2.5 Errores de muestreo pa
- Page 325 and 326:
Cuadro B.2.7 Errores de muestreo pa
- Page 327 and 328:
Cuadro B.2.9 Errores de muestreo pa
- Page 329 and 330:
Cuadro B.2.11 Errores de muestreo p
- Page 331 and 332:
Cuadro B.2.13 Errores de muestreo p
- Page 333 and 334:
Cuadro B.2.15 Errores de muestreo p
- Page 335 and 336:
Cuadro B.2.17 Errores de muestreo p
- Page 337 and 338:
Cuadro B.2.19 Errores de muestreo p
- Page 339 and 340:
Cuadro B.2.21 Errores de muestreo p
- Page 341 and 342:
Cuadro B.2.23 Errores de muestreo p
- Page 343 and 344:
Cuadro B.2.25 Errores de muestreo p
- Page 345 and 346:
Cuadro B.2.27 Errores de muestreo p
- Page 347 and 348:
Cuadro B.2.29 Errores de muestreo p
- Page 349 and 350:
Cuadro B.2.31 Errores de muestreo p
- Page 351 and 352:
Cuadro B.2.33 Errores de muestreo p
- Page 353 and 354:
Cuadro B.2.35 Errores de muestreo p
- Page 355 and 356:
Cuadro B.2.37 Errores de muestreo p
- Page 357 and 358:
346 Encuesta Demográfica y de Salu
- Page 359 and 360:
Cuadro C.1 Distribución por edad d
- Page 361 and 362:
Cuadro C.4 Nacimientos a mujeres en
- Page 363 and 364:
Cuadro C.6 Edad al fallecimiento en
- Page 366 and 367:
PERSONAL DE LA ENCUESTA APÉNDICE D
- Page 368 and 369:
Lambayeque: Leoncio Benjamín Espin
- Page 370:
MUESTREO Y MARCOS MUESTRALES Direct
- Page 374 and 375:
1A ANOTE LA HORA DE INICIO Nº OR-
- Page 376 and 377:
Nº OR- DEN 01 02 03 04 05 06 07 08
- Page 378 and 379:
Nº PREGUNTAS Y FILTROS CATEGORÍAS
- Page 380 and 381:
Nº PREGUNTAS Y FILTROS CATEGORÍAS
- Page 382 and 383:
Nº PREGUNTAS Y FILTROS CATEGORÍAS
- Page 384 and 385:
Nº PREGUNTAS Y FILTROS CATEGORÍAS
- Page 386 and 387:
SECCIÓN 4. PRUEBA DE HEMOGLOBINA M
- Page 388 and 389:
Nº PREGUNTAS Y FILTROS CATEGORÍAS
- Page 390 and 391:
OBSERVACIONES DE LA ENTREVISTADORA
- Page 392 and 393:
PROCEDIMIENTO DE SELECCIÓN DE LA M
- Page 394 and 395:
TABLA DE CONVERSION EDAD-FECHA DE N
- Page 396 and 397:
PREG. PREGUNTAS Y FILTROS CATEGORÍ
- Page 398 and 399:
HISTORIA DE NACIMIENTOS Ahora me gu
- Page 400 and 401:
PREG. PREGUNTAS Y FILTROS CATEGORÍ
- Page 402 and 403:
SECCIÓN 3. ANTICONCEPCIÓN 300 Aho
- Page 404 and 405:
PREG. PREGUNTAS Y FILTROS CATEGORÍ
- Page 406 and 407:
PREG. PREGUNTAS Y FILTROS CATEGORÍ
- Page 408 and 409:
PREG. PREGUNTAS Y FILTROS CATEGORÍ
- Page 410 and 411:
401 VERIFIQUE 224: UNO O MÁS NACIM
- Page 412 and 413:
ÚLTIMO NACIDO VIVO PENÚLTIMO NACI
- Page 414 and 415:
ÚLTIMO NACIDO VIVO PENÚLTIMO NACI
- Page 416 and 417:
ÚLTIMO NACIDO VIVO PENÚLTIMO NACI
- Page 418 and 419:
ÚLTIMO NACIDO VIVO PENÚLTIMO NACI
- Page 420 and 421:
ÚLTIMO NACIDO VIVO PENÚLTIMO NACI
- Page 422 and 423:
ÚLTIMO NACIDO VIVO PENÚLTIMO NACI
- Page 424 and 425:
ÚLTIMO NACIDO VIVO PENÚLTIMO NACI
- Page 426 and 427:
ÚLTIMO NACIDO VIVO PENÚLTIMO NACI
- Page 428 and 429:
ÚLTIMO NACIDO VIVO PENÚLTIMO NACI
- Page 430 and 431:
PREG. PREGUNTAS Y FILTROS CATEGORÍ
- Page 432 and 433:
PREG. PREGUNTAS Y FILTROS SECCIÓN
- Page 434 and 435:
513A ÚLTIMA PAREJA SEXUAL PENÚLTI
- Page 436 and 437:
601 VERIFIQUE 311: NINGUNO ESTERILI
- Page 438 and 439:
PREG. 612 ¿Cuál es la razón prin
- Page 440 and 441:
PREG. SECCIÓN 7. ANTECEDENTES DEL
- Page 442 and 443:
SECCIÓN 8. SIDA Y OTRAS I.T.S. PRE
- Page 444 and 445:
PREG. PREGUNTAS Y FILTROS CATEGORÍ
- Page 446 and 447:
PREG. 901 902 903 904 905 906 907 9
- Page 448 and 449:
PREG. PREGUNTAS Y FILTROS CATEGORÍ
- Page 450 and 451:
PREG. PREGUNTAS Y FILTROS CATEGORÍ
- Page 452 and 453:
PREG. PREGUNTAS Y FILTROS CATEGORÍ
- Page 454:
CALENDARIO 2009 ENERO FEBRERO D L M


![Obtaining Informed Consent for HIV Testing [QRS4] - Measure DHS](https://img.yumpu.com/49850117/1/190x245/obtaining-informed-consent-for-hiv-testing-qrs4-measure-dhs.jpg?quality=85)


