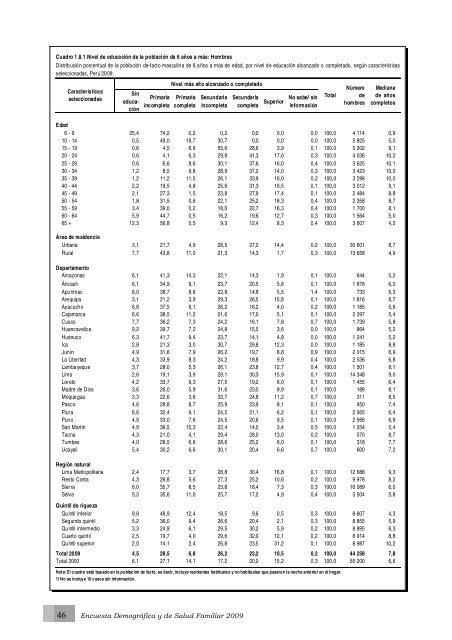
Cuadro 1.8.1 Nivel <strong>de</strong> educación <strong>de</strong> la población <strong>de</strong> 6 años a más: Hombres Distribución porcentual <strong>de</strong> la población <strong>de</strong>-facto masculina <strong>de</strong> 6 años a más <strong>de</strong> edad, por nivel <strong>de</strong> educación alcanzado o completado, según características seleccionadas, <strong>Perú</strong> 2009. Características seleccionadas Sin educación Primaria incompleta Nivel más alto alcanzado o completado Primaria completa Secundaria incompleta 46 <strong>Encuesta</strong> <strong>Demográfica</strong> y <strong>de</strong> <strong>Salud</strong> <strong>Familiar</strong> 2009 Secundaria completa Superior No sabe/ sin información Edad 6 - 9 25,4 74,2 0,2 0,2 0,0 0,0 0,0 100,0 4 114 0,9 10 - 14 0,5 49,0 19,7 30,7 0,0 0,0 0,0 100,0 5 825 5,0 15 - 19 0,6 4,5 6,6 55,6 28,6 3,9 0,1 100,0 5 202 9,1 20 - 24 0,6 4,1 6,3 29,8 41,3 17,6 0,3 100,0 4 036 10,2 25 - 29 0,6 6,6 8,6 30,1 37,6 16,0 0,4 100,0 3 625 10,1 30 - 34 1,2 8,5 9,8 28,9 37,2 14,0 0,3 100,0 3 423 10,0 35 - 39 1,2 11,2 11,5 26,1 33,9 16,0 0,2 100,0 3 298 10,0 40 - 44 2,2 19,5 4,8 25,6 31,3 16,5 0,1 100,0 3 012 9,1 45 - 49 2,1 27,3 1,5 23,8 27,9 17,4 0,1 100,0 2 484 8,8 50 - 54 1,8 31,5 0,6 22,1 25,2 18,3 0,4 100,0 2 358 8,7 55 - 59 3,4 39,0 0,2 18,0 22,7 16,3 0,4 100,0 1 700 8,1 60 - 64 5,9 44,7 0,5 16,2 19,6 12,7 0,3 100,0 1 564 5,0 65 + 12,3 56,8 0,5 9,3 12,4 8,3 0,4 100,0 3 607 4,2 Área <strong>de</strong> resi<strong>de</strong>ncia Urbana 3,1 21,7 4,9 28,5 27,2 14,4 0,2 100,0 30 601 8,7 Rural 7,7 43,8 11,0 21,3 14,3 1,7 0,3 100,0 13 658 4,9 Departamento Amazonas 6,1 41,3 14,3 22,1 14,3 1,9 0,1 100,0 644 5,2 Áncash 6,1 34,9 9,1 23,7 20,5 5,6 0,1 100,0 1 878 6,0 Apurímac 8,0 38,7 8,8 22,8 14,8 5,5 1,4 100,0 733 5,3 Arequipa 3,1 21,2 3,9 29,3 26,5 15,8 0,1 100,0 1 816 8,7 Ayacucho 6,8 37,5 9,1 26,2 16,2 4,0 0,2 100,0 1 185 5,6 Cajamarca 6,6 38,5 11,2 21,6 17,0 5,1 0,1 100,0 2 297 5,4 Cusco 7,7 36,2 7,3 24,2 16,1 7,8 0,7 100,0 1 739 5,8 Huancavelica 9,2 39,7 7,2 24,8 15,5 3,6 0,0 100,0 864 5,2 Huánuco 6,3 41,7 9,4 23,7 14,1 4,8 0,0 100,0 1 241 5,2 Ica 2,8 21,3 3,0 30,7 29,8 12,3 0,0 100,0 1 185 8,8 Junín 4,9 31,6 7,9 26,2 19,7 8,8 0,9 100,0 2 015 6,9 La Libertad 4,3 33,9 8,3 24,2 18,8 9,9 0,4 100,0 2 536 6,8 Lambayeque 3,7 28,0 5,3 26,1 23,8 12,7 0,4 100,0 1 501 8,1 Lima 2,6 19,1 3,9 28,1 30,3 15,9 0,1 100,0 14 348 9,0 Loreto 4,2 33,7 9,3 27,5 19,2 6,0 0,1 100,0 1 455 6,4 Madre <strong>de</strong> Dios 3,6 26,0 5,9 31,6 23,0 9,9 0,1 100,0 188 8,1 Moquegua 3,3 22,6 3,6 33,7 24,8 11,2 0,7 100,0 311 8,5 Pasco 4,6 28,8 8,7 25,9 23,9 8,1 0,1 100,0 450 7,4 Piura 6,6 32,4 9,1 24,5 21,1 6,2 0,1 100,0 2 565 6,4 Puno 4,9 33,0 7,6 24,5 20,6 9,5 0,1 100,0 2 566 6,9 San Martín 4,9 39,5 15,3 22,4 14,0 3,4 0,5 100,0 1 254 5,4 Tacna 4,3 21,0 4,1 29,4 28,0 13,0 0,2 100,0 570 8,7 Tumbes 4,0 29,5 6,6 28,6 25,2 6,0 0,1 100,0 318 7,7 Ucayali 5,4 30,2 6,6 30,1 20,4 6,6 0,7 100,0 600 7,2 Región natural Lima Metropolitana 2,4 17,7 3,7 28,8 30,4 16,8 0,1 100,0 12 688 9,3 Resto Costa 4,3 26,8 5,6 27,3 25,2 10,6 0,2 100,0 9 978 8,2 Sierra 6,0 35,7 8,5 23,8 18,4 7,3 0,3 100,0 16 089 6,0 Selva 5,3 35,6 11,0 25,7 17,2 4,9 0,4 100,0 5 504 5,8 Quintil <strong>de</strong> riqueza Quintil inferior 9,8 48,9 12,4 18,5 9,6 0,5 0,3 100,0 8 607 4,3 Segundo quintil 5,2 36,0 9,4 26,6 20,4 2,1 0,3 100,0 8 855 5,9 Quintil intermedio 3,3 24,9 6,1 29,5 30,2 5,9 0,2 100,0 8 895 8,3 Cuarto quintil 2,5 19,7 4,0 29,6 32,0 12,1 0,2 100,0 8 914 8,8 Quintil superior 2,0 14,1 2,4 26,8 23,5 31,2 0,1 100,0 8 987 10,2 Total 2009 4,5 28,5 6,8 26,2 23,2 10,5 0,2 100,0 44 258 7,8 Total 2000 6,1 27,1 14,1 17,2 20,0 15,2 0,3 100,0 55 200 6,6 Nota: El cuadro está basado en la población <strong>de</strong> facto, es <strong>de</strong>cir, incluye resi<strong>de</strong>ntes habituales y no habituales que pasaron la noche anterior en el hogar. 1/ No se incluye 10 casos sin información. Total Número <strong>de</strong> hombres Mediana <strong>de</strong> años completos
Cuadro 1.8.2 Nivel <strong>de</strong> educación <strong>de</strong> la población <strong>de</strong> 6 años a más: Mujeres Distribución porcentual <strong>de</strong> la población femenina <strong>de</strong>-facto <strong>de</strong> 6 años a más, por nivel <strong>de</strong> educación alcanzado o completado, según características seleccionadas, <strong>Perú</strong> 2009. Sin educación Primaria incompleta Edad 6 - 9 24,9 74,8 0,1 0,2 0,0 0,0 0,0 100,0 4 044 0,9 10 - 14 0,4 47,6 19,5 32,5 0,0 0,0 0,0 100,0 5 622 5,1 15 - 19 0,5 5,2 7,2 52,9 29,6 4,5 0,0 100,0 4 825 9,1 20 - 24 1,0 7,3 7,8 31,9 34,6 17,4 0,0 100,0 4 024 10,1 25 - 29 1,7 10,3 11,3 29,5 32,2 14,8 0,1 100,0 3 844 9,1 30 - 34 2,4 13,3 11,5 27,3 32,1 13,3 0,1 100,0 3 616 8,9 35 - 39 3,7 16,0 12,0 25,1 28,2 14,8 0,2 100,0 3 696 8,7 40 - 44 5,7 27,7 5,1 25,1 24,2 12,2 0,0 100,0 3 127 8,3 45 - 49 8,6 33,0 1,5 20,1 23,3 13,6 0,0 100,0 2 681 8,1 50 - 54 11,5 37,6 0,7 17,6 21,3 11,2 0,1 100,0 2 663 6,0 55 - 59 19,7 38,6 0,4 13,8 18,5 8,8 0,1 100,0 2 014 4,5 60 - 64 25,9 41,8 0,3 8,3 15,9 7,7 0,1 100,0 1 663 4,0 65 + 40,2 41,1 0,2 5,0 10,4 3,1 0,1 100,0 4 188 1,3 Área <strong>de</strong> resi<strong>de</strong>ncia Urbana 5,9 24,5 5,2 27,4 25,0 11,9 0,1 100,0 32 743 8,3 Rural Departamento 20,1 42,6 12,0 16,3 8,2 0,7 0,1 100,0 13 273 3,6 Amazonas 12,0 43,2 14,2 18,8 10,6 1,1 0,0 100,0 631 4,6 Áncash 16,2 36,2 8,0 21,5 12,6 5,6 0,0 100,0 1 900 4,7 Apurímac 24,8 35,7 8,2 19,1 9,0 3,0 0,2 100,0 766 3,6 Arequipa 7,9 26,3 4,3 26,2 22,6 12,6 0,0 100,0 1 846 8,2 Ayacucho 19,5 38,1 9,9 18,6 10,6 3,2 0,0 100,0 1 167 4,0 Cajamarca 18,5 37,5 11,4 16,5 12,2 3,8 0,1 100,0 2 335 4,3 Cusco 19,0 34,2 8,0 19,6 12,1 6,7 0,4 100,0 1 831 4,5 Huancavelica 21,7 39,1 11,7 18,8 7,2 1,6 0,0 100,0 965 3,4 Huánuco 18,7 40,1 7,6 19,1 10,7 3,7 0,1 100,0 1 292 4,1 Ica 6,1 24,4 4,0 28,5 27,7 9,2 0,0 100,0 1 204 8,3 Junín 11,8 33,2 9,0 23,8 15,1 7,0 0,1 100,0 2 079 5,6 La Libertad 8,8 32,4 8,6 22,6 18,4 9,0 0,2 100,0 2 709 6,0 Lambayeque 7,4 27,6 5,5 24,3 23,7 11,1 0,3 100,0 1 686 8,0 Lima 4,1 21,2 4,1 27,9 29,0 13,6 0,1 100,0 15 241 8,8 Loreto 8,0 35,2 10,1 25,8 15,8 5,1 0,0 100,0 1 462 5,7 Madre <strong>de</strong> Dios 7,6 28,1 7,5 29,7 19,7 7,3 0,1 100,0 164 6,9 Moquegua 7,4 24,4 5,1 29,4 23,5 10,1 0,1 100,0 320 8,2 Pasco 12,5 30,5 10,4 26,0 14,4 6,2 0,0 100,0 439 5,7 Piura 10,3 33,6 9,5 25,0 16,7 4,9 0,0 100,0 2 688 5,6 Puno 15,5 35,5 10,0 19,4 13,7 5,9 0,0 100,0 2 674 4,9 San Martín 10,2 42,1 11,4 20,8 13,4 2,0 0,1 100,0 1 132 4,8 Tacna 6,7 24,5 6,3 27,1 25,1 10,3 0,1 100,0 543 8,0 Tumbes 5,0 32,1 6,9 28,0 23,7 4,3 0,1 100,0 332 7,1 Ucayali Región natural 8,2 33,4 7,9 28,0 18,6 3,8 0,1 100,0 609 6,1 Lima Metropolitana 3,9 20,4 3,4 28,5 29,8 13,9 0,1 100,0 13 621 8,8 Resto Costa 7,0 27,8 6,7 26,5 22,2 9,6 0,1 100,0 10 489 7,5 Sierra 16,8 36,1 9,6 19,2 12,8 5,4 0,1 100,0 16 721 4,7 Selva Quintil <strong>de</strong> riqueza 10,1 37,3 10,0 24,3 14,6 3,6 0,1 100,0 5 184 5,3 Quintil inferior 24,8 45,8 12,3 12,3 4,5 0,2 0,1 100,0 8 606 2,7 Segundo quintil 13,7 38,0 11,1 22,8 13,4 0,9 0,0 100,0 8 606 4,8 Quintil intermedio 6,8 28,5 7,6 28,6 24,2 4,2 0,1 100,0 9 112 7,2 Cuarto quintil 4,6 22,7 4,0 29,5 29,4 9,7 0,1 100,0 9 590 8,5 Quintil superior 2,3 16,6 2,0 26,4 27,0 25,7 0,1 100,0 10 101 10,1 Total 2009 Total 2000 Características seleccionadas 1/ No se incluye 9 casos sin información. Nivel más alto alcanzado o completado Mediana Primaria Secundaria Secundaria Superior No sabe/ sin Total Número <strong>de</strong> años completa incompleta completa y mas información completos 10,0 29,7 7,2 24,2 20,2 8,7 0,1 100,0 46 016 6,6 12,9 28,2 13,7 15,3 16,2 13,4 0,3 100,0 55 959 5,6 Nota: El cuadro está basado en la población <strong>de</strong> facto, es <strong>de</strong>cir, incluye resi<strong>de</strong>ntes habituales y no habituales que pasaron la noche anterior en el hogar. Características <strong>de</strong> los hogares y la población 47
- Page 3 and 4: Encuesta Demográfica y de Salud Fa
- Page 5: PREPARACIÓN DEL INFORME PROGRAMA M
- Page 8 and 9: Intenciones de uso en el futuro ...
- Page 10 and 11: Lista de Cuadros CAPÍTULO 1: CARAC
- Page 12 and 13: Cuadro 6.11 Planificación de la fe
- Page 14 and 15: Lista de Gráficos CAPÍTULO 1: CAR
- Page 17: Presentación El Instituto Nacional
- Page 20 and 21: ESTIMACIONES MUESTRALES INDICADORES
- Page 22 and 23: puntos porcentuales en relación a
- Page 24 and 25: encuentra el DIU de 9,1 a 3,8 por c
- Page 26 and 27: nacimientos no deseados pudiesen se
- Page 28 and 29: En cuanto a la percepción de la ma
- Page 30 and 31: La desnutrición crónica afectó a
- Page 32 and 33: ciento de ellas, fueron obligadas a
- Page 34 and 35: ENERGÍA ELÉCTRICA FUENTE DE AGUA
- Page 36 and 37: Cuadro 1.1.1 Características de la
- Page 38 and 39: Cuadros 1.2.1 y 1.2.2 Bienes de con
- Page 40 and 41: países que han participado en la c
- Page 42 and 43: Cuadro 1.4 Población de los hogare
- Page 44 and 45: esidencia, esta proporción fue may
- Page 46 and 47: Cuadro 1.7 Orfandad de los niños,
- Page 50 and 51: Asistencia escolar por edad • Dur
- Page 52 and 53: Cuadro 2.1 Características de las
- Page 54 and 55: Cuadro 2.2 Nivel de educación de l
- Page 56 and 57: Cuadro 2.4 Alfabetismo de las mujer
- Page 58 and 59: Cuadro 2.5 Acceso de las mujeres a
- Page 60 and 61: Cuadro 2.6 Trabajo en los últimos
- Page 62 and 63: Cuadro 2.7 Tipo de ocupación de la
- Page 64 and 65: Cuadro 2.8 Empleador y forma de rem
- Page 66 and 67: • Según lugar de residencia, las
- Page 68 and 69: Cuadro 2.11 Última palabra en deci
- Page 70 and 71: • Las MEF con seguro de ESSALUD,
- Page 72 and 73: Cuadro 2.13 Cobertura de seguro de
- Page 74 and 75: Cuadro 2.14 Conocimiento y actitude
- Page 76 and 77: 74 Encuesta Demográfica y de Salud
- Page 78 and 79: Niveles de fecundidad Cuadro 3.1
- Page 80: • Las mujeres del área rural tie
- Page 83 and 84: TOTAL ÁREA DE RESIDENCIA Urbana Ru
- Page 85 and 86: 3.2 FECUNDIDAD ACUMULADA En esta se
- Page 87 and 88: Cuadro 3.7 Intervalo entre nacimien
- Page 89 and 90: Cuadro 3.9 Mediana de edad al prime
- Page 91 and 92: Cuadro 3.10 y Gráfico 3.4 • •
- Page 93 and 94: • Entre las mujeres no unidas con
- Page 95 and 96: 4.2 USO DE MÉTODOS Con el objeto d
- Page 97 and 98: Prevalencia actual del uso de méto
- Page 99 and 100:
• Entre la ENDES 2000 y la ENDES
- Page 101 and 102:
Cuadro 4.5.1 Uso actual de métodos
- Page 103 and 104:
Cuadro 4.6 Cambios en la mezcla de
- Page 105 and 106:
Edad al momento de la esterilizaci
- Page 107 and 108:
Cuadro 4.10 Fuente de suministro de
- Page 109 and 110:
4.3 DISCONTINUACIÓN DEL USO DE MÉ
- Page 111 and 112:
Intenciones de uso en el futuro A l
- Page 113 and 114:
4.4 MENSAJES SOBRE PLANIFICACIÓN F
- Page 115 and 116:
TOTAL ÁREA DE RESIDENCIA Urbana Ru
- Page 117 and 118:
En la ENDES Continua 2009 también
- Page 119 and 120:
116 Encuesta Demográfica y de Salu
- Page 121 and 122:
Cuadro 5.1 Estado conyugal actual d
- Page 123 and 124:
Cuadro 5.3 Estado conyugal actual d
- Page 125 and 126:
Cuadro 5.4 Tipo de compañero sexua
- Page 127 and 128:
Cuadro 5.6 Edad mediana a la primer
- Page 129 and 130:
5.3 EDAD A LA PRIMERA RELACIÓN SEX
- Page 131 and 132:
Cuadro 5.8 Edad mediana a la primer
- Page 133 and 134:
• Ciertamente, no es la situació
- Page 135 and 136:
ponderando el tiempo con la proporc
- Page 137 and 138:
5.6 EXPOSICIÓN AL RIESGO DE EMBARA
- Page 139 and 140:
dentro de los próximos dos años,
- Page 141 and 142:
La evolución entre la ENDES 1986 y
- Page 143 and 144:
Quienes no están en ninguna de est
- Page 145 and 146:
Cuadro 6.6 Necesidad de servicios d
- Page 147 and 148:
Usualmente existe una alta asociaci
- Page 149 and 150:
Cuadro 6.9 Promedio ideal de hijos,
- Page 151 and 152:
En el Cuadro 6.11 se presenta la di
- Page 153 and 154:
Cuadro 6.12 Fecundidad deseada y ob
- Page 155 and 156:
Especial atención debe prestarse a
- Page 157 and 158:
• El nivel educativo de la madre
- Page 159:
fecundidad y la mortalidad infantil
- Page 162 and 163:
Defunciones por mil nacidos vivos 7
- Page 164 and 165:
Cuadro 7.6 Tanto los nacidos muerto
- Page 166 and 167:
• El 63,4 por ciento de las mujer
- Page 168 and 169:
Estimación de la Mortalidad Adulta
- Page 170 and 171:
puede calcular la tasa de mortalida
- Page 172 and 173:
Atención prenatal por fuente de at
- Page 174:
Cuadros 8.2, 8.3 y Gráfico 8.1 Nú
- Page 177 and 178:
NÚMERO DE VISITAS Gráfico 8.1 Vis
- Page 179 and 180:
8.2 ATENCIÓN DEL PARTO Lugar de oc
- Page 181 and 182:
• Se resaltan diferencias de acue
- Page 183 and 184:
Cuadro 8.6 Atención durante el par
- Page 185 and 186:
constituye una situación en extrem
- Page 187 and 188:
Cuadros 8.8.1 y 8.8.2 Persona que p
- Page 189 and 190:
Cuadro 8.8.2 Proveedores de atenci
- Page 191 and 192:
Cuadro 8.9 Problemas en el acceso a
- Page 193:
Cuadro 9.1 Peso y tamaño al nacer
- Page 196:
Vacunaciones por características s
- Page 199 and 200:
Vacunaciones entre niñas y niños
- Page 201:
Cuadro 9.5 Prevalencia y tratamient
- Page 204 and 205:
Cuadro 9.6 Prevalencia y tratamient
- Page 206 and 207:
Cuadro 9.7 Prevalencia de diarrea P
- Page 208 and 209:
Cuadro 9.8 Tratamiento de la diarre
- Page 210 and 211:
Cuadro 9.9 Prácticas de alimentaci
- Page 212 and 213:
Cuadro 9.11 Eliminación de las dep
- Page 214 and 215:
206 Encuesta Demográfica y de Salu
- Page 216 and 217:
• Los menores porcentajes de lact
- Page 218 and 219:
10.2 LACTANCIA Y ALIMENTACIÓN SUPL
- Page 220:
10.3 DURACIÓN DE LA LACTANCIA El C
- Page 223 and 224:
10.4 TIPO DE ALIMENTACIÓN COMPLEME
- Page 225 and 226:
Frecuencia de comidas recibidas en
- Page 227 and 228:
Micronutrientes (Cuadro 10.6 y 10.7
- Page 229 and 230:
Cuadro 10.7 Ingesta de micronutrien
- Page 231:
El nivel requerido de hemoglobina e
- Page 234 and 235:
Cuadro 10.8.2 Pre valencia de anemi
- Page 236 and 237:
10.6 NUTRICIÓN DE NIÑAS Y NIÑOS
- Page 238 and 239:
Desnutrición crónica según carac
- Page 240 and 241:
Desnutrición global según grupos
- Page 242:
Cuadro 10.9.2 Indicadores de desnut
- Page 245 and 246:
La baja estatura materna está vinc
- Page 247 and 248:
Cuadro 10.11 La talla como un indic
- Page 249 and 250:
• Por departamento, San Martín y
- Page 251 and 252:
240 Encuesta Demográfica y de Salu
- Page 253 and 254:
Conocimiento de VIH/SIDA (Cuadro 11
- Page 255 and 256:
Gráfico 11.1 Conocimiento de forma
- Page 257 and 258:
Urbana, en la Sierra y Selva, entre
- Page 259 and 260:
Cuadro 11.3 Aspectos sociales de la
- Page 261 and 262:
TOTAL ÁREA DE RESIDENCIA Urbana Ru
- Page 263 and 264:
Cuadro 11.4 Conocimiento de los sí
- Page 265 and 266:
11.4 PREVALENCIA DE LAS INFECCIONES
- Page 267 and 268:
Cuadro 11.6 Prevalencia de infeccio
- Page 269 and 270:
11.5 CONDUCTA SEXUAL, USO DEL COND
- Page 271 and 272:
11.8.1 Número de parejas sexuales
- Page 273 and 274:
• Los datos presentes hacen notar
- Page 275 and 276:
Cuadro 11.10 Uso de condón por tip
- Page 277 and 278:
También se brinda información sob
- Page 279 and 280:
Gráfico 12.1 Situaciones de contro
- Page 281 and 282:
12.2 VIOLENCIA FÍSICA CONTRA LA MU
- Page 283 and 284:
Cuadro 12.2 Violencia intrafamiliar
- Page 285 and 286:
Cuadro 12.3 • El 14,2 por ciento
- Page 287 and 288:
Cuadro 12.4 • La quinta parte de
- Page 289 and 290:
Cuadro 12.4 Violencia intrafamiliar
- Page 291 and 292:
Cuadro 12.6. Violencia intrafamilia
- Page 293 and 294:
Gráfico 12.3 Violencia fìsica por
- Page 295 and 296:
Cuadro 12.8 La ENDES Continua 2009
- Page 297 and 298:
• Por área de residencia, el may
- Page 299 and 300:
Cuadro 12.10 Violencia intrafamilia
- Page 301 and 302:
Cuadro 12.12 Violencia intrafamilia
- Page 303 and 304:
292 Encuesta Demográfica y de Salu
- Page 305 and 306:
Entre las ventajas de esta aplicaci
- Page 307 and 308:
• El total de muestra estimado en
- Page 309 and 310:
• Se calcula el número de grupos
- Page 311 and 312:
Cuadro A.3 Implementación de la mu
- Page 313 and 314:
302 Encuesta Demográfica y de Salu
- Page 315 and 316:
en donde () ⎟ H mh 2 1− f m ⎛
- Page 317 and 318:
Cuadro B.1 Variables seleccionadas
- Page 319 and 320:
Cuadro B.2.1 Errores de muestreo pa
- Page 321 and 322:
Cuadro B.2.3 Errores de muestreo pa
- Page 323 and 324:
Cuadro B.2.5 Errores de muestreo pa
- Page 325 and 326:
Cuadro B.2.7 Errores de muestreo pa
- Page 327 and 328:
Cuadro B.2.9 Errores de muestreo pa
- Page 329 and 330:
Cuadro B.2.11 Errores de muestreo p
- Page 331 and 332:
Cuadro B.2.13 Errores de muestreo p
- Page 333 and 334:
Cuadro B.2.15 Errores de muestreo p
- Page 335 and 336:
Cuadro B.2.17 Errores de muestreo p
- Page 337 and 338:
Cuadro B.2.19 Errores de muestreo p
- Page 339 and 340:
Cuadro B.2.21 Errores de muestreo p
- Page 341 and 342:
Cuadro B.2.23 Errores de muestreo p
- Page 343 and 344:
Cuadro B.2.25 Errores de muestreo p
- Page 345 and 346:
Cuadro B.2.27 Errores de muestreo p
- Page 347 and 348:
Cuadro B.2.29 Errores de muestreo p
- Page 349 and 350:
Cuadro B.2.31 Errores de muestreo p
- Page 351 and 352:
Cuadro B.2.33 Errores de muestreo p
- Page 353 and 354:
Cuadro B.2.35 Errores de muestreo p
- Page 355 and 356:
Cuadro B.2.37 Errores de muestreo p
- Page 357 and 358:
346 Encuesta Demográfica y de Salu
- Page 359 and 360:
Cuadro C.1 Distribución por edad d
- Page 361 and 362:
Cuadro C.4 Nacimientos a mujeres en
- Page 363 and 364:
Cuadro C.6 Edad al fallecimiento en
- Page 366 and 367:
PERSONAL DE LA ENCUESTA APÉNDICE D
- Page 368 and 369:
Lambayeque: Leoncio Benjamín Espin
- Page 370:
MUESTREO Y MARCOS MUESTRALES Direct
- Page 374 and 375:
1A ANOTE LA HORA DE INICIO Nº OR-
- Page 376 and 377:
Nº OR- DEN 01 02 03 04 05 06 07 08
- Page 378 and 379:
Nº PREGUNTAS Y FILTROS CATEGORÍAS
- Page 380 and 381:
Nº PREGUNTAS Y FILTROS CATEGORÍAS
- Page 382 and 383:
Nº PREGUNTAS Y FILTROS CATEGORÍAS
- Page 384 and 385:
Nº PREGUNTAS Y FILTROS CATEGORÍAS
- Page 386 and 387:
SECCIÓN 4. PRUEBA DE HEMOGLOBINA M
- Page 388 and 389:
Nº PREGUNTAS Y FILTROS CATEGORÍAS
- Page 390 and 391:
OBSERVACIONES DE LA ENTREVISTADORA
- Page 392 and 393:
PROCEDIMIENTO DE SELECCIÓN DE LA M
- Page 394 and 395:
TABLA DE CONVERSION EDAD-FECHA DE N
- Page 396 and 397:
PREG. PREGUNTAS Y FILTROS CATEGORÍ
- Page 398 and 399:
HISTORIA DE NACIMIENTOS Ahora me gu
- Page 400 and 401:
PREG. PREGUNTAS Y FILTROS CATEGORÍ
- Page 402 and 403:
SECCIÓN 3. ANTICONCEPCIÓN 300 Aho
- Page 404 and 405:
PREG. PREGUNTAS Y FILTROS CATEGORÍ
- Page 406 and 407:
PREG. PREGUNTAS Y FILTROS CATEGORÍ
- Page 408 and 409:
PREG. PREGUNTAS Y FILTROS CATEGORÍ
- Page 410 and 411:
401 VERIFIQUE 224: UNO O MÁS NACIM
- Page 412 and 413:
ÚLTIMO NACIDO VIVO PENÚLTIMO NACI
- Page 414 and 415:
ÚLTIMO NACIDO VIVO PENÚLTIMO NACI
- Page 416 and 417:
ÚLTIMO NACIDO VIVO PENÚLTIMO NACI
- Page 418 and 419:
ÚLTIMO NACIDO VIVO PENÚLTIMO NACI
- Page 420 and 421:
ÚLTIMO NACIDO VIVO PENÚLTIMO NACI
- Page 422 and 423:
ÚLTIMO NACIDO VIVO PENÚLTIMO NACI
- Page 424 and 425:
ÚLTIMO NACIDO VIVO PENÚLTIMO NACI
- Page 426 and 427:
ÚLTIMO NACIDO VIVO PENÚLTIMO NACI
- Page 428 and 429:
ÚLTIMO NACIDO VIVO PENÚLTIMO NACI
- Page 430 and 431:
PREG. PREGUNTAS Y FILTROS CATEGORÍ
- Page 432 and 433:
PREG. PREGUNTAS Y FILTROS SECCIÓN
- Page 434 and 435:
513A ÚLTIMA PAREJA SEXUAL PENÚLTI
- Page 436 and 437:
601 VERIFIQUE 311: NINGUNO ESTERILI
- Page 438 and 439:
PREG. 612 ¿Cuál es la razón prin
- Page 440 and 441:
PREG. SECCIÓN 7. ANTECEDENTES DEL
- Page 442 and 443:
SECCIÓN 8. SIDA Y OTRAS I.T.S. PRE
- Page 444 and 445:
PREG. PREGUNTAS Y FILTROS CATEGORÍ
- Page 446 and 447:
PREG. 901 902 903 904 905 906 907 9
- Page 448 and 449:
PREG. PREGUNTAS Y FILTROS CATEGORÍ
- Page 450 and 451:
PREG. PREGUNTAS Y FILTROS CATEGORÍ
- Page 452 and 453:
PREG. PREGUNTAS Y FILTROS CATEGORÍ
- Page 454:
CALENDARIO 2009 ENERO FEBRERO D L M


![Obtaining Informed Consent for HIV Testing [QRS4] - Measure DHS](https://img.yumpu.com/49850117/1/190x245/obtaining-informed-consent-for-hiv-testing-qrs4-measure-dhs.jpg?quality=85)


