Las condiciones habitacionales de los hogares y su relación con la ...
Las condiciones habitacionales de los hogares y su relación con la ...
Las condiciones habitacionales de los hogares y su relación con la ...

You also want an ePaper? Increase the reach of your titles
YUMPU automatically turns print PDFs into web optimized ePapers that Google loves.
178<br />
<strong>Las</strong> <strong><strong>con</strong>diciones</strong> <strong>habitacionales</strong> <strong>de</strong> <strong>los</strong> <strong>hogares</strong> y <strong>su</strong> <strong>re<strong>la</strong>ción</strong> <strong>con</strong> <strong>la</strong> pobreza<br />
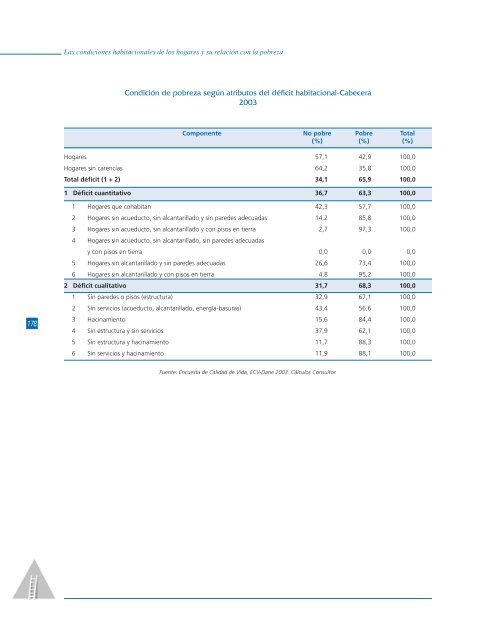
Condición <strong>de</strong> pobreza según atributos <strong>de</strong>l déficit habitacional-Cabecera<br />
2003<br />
Componente No pobre Pobre Total<br />
(%) (%) (%)<br />
Hogares 57,1 42,9 100,0<br />
Hogares sin carencias 64,2 35,8 100,0<br />
Total déficit (1 + 2) 34,1 65,9 100,0<br />
1 Déficit cuantitativo 36,7 63,3 100,0<br />
1 Hogares que cohabitan 42,3 57,7 100,0<br />
2 Hogares sin acueducto, sin alcantaril<strong>la</strong>do y sin pare<strong>de</strong>s a<strong>de</strong>cuadas 14,2 85,8 100,0<br />
3 Hogares sin acueducto, sin alcantaril<strong>la</strong>do y <strong>con</strong> pisos en tierra 2,7 97,3 100,0<br />
4 Hogares sin acueducto, sin alcantaril<strong>la</strong>do, sin pare<strong>de</strong>s a<strong>de</strong>cuadas<br />
y <strong>con</strong> pisos en tierra 0,0 0,0 0,0<br />
5 Hogares sin alcantaril<strong>la</strong>do y sin pare<strong>de</strong>s a<strong>de</strong>cuadas 26,6 73,4 100,0<br />
6 Hogares sin alcantaril<strong>la</strong>do y <strong>con</strong> pisos en tierra 4,8 95,2 100,0<br />
2 Déficit cualitativo 31,7 68,3 100,0<br />
1 Sin pare<strong>de</strong>s o pisos (estructura) 32,9 67,1 100,0<br />
2 Sin servicios (acueducto, alcantaril<strong>la</strong>do, energía-ba<strong>su</strong>ras) 43,4 56,6 100,0<br />
3 Hacinamiento 15,6 84,4 100,0<br />
4 Sin estructura y sin servicios 37,9 62,1 100,0<br />
5 Sin estructura y hacinamiento 11,7 88,3 100,0<br />
6 Sin servicios y hacinamiento 11,9 88,1 100,0<br />
Fuente: Encuesta <strong>de</strong> Calidad <strong>de</strong> Vida, ECV-Dane 2003. Cálcu<strong>los</strong> Con<strong>su</strong>ltor.