Las condiciones habitacionales de los hogares y su relación con la ...
Las condiciones habitacionales de los hogares y su relación con la ...
Las condiciones habitacionales de los hogares y su relación con la ...

You also want an ePaper? Increase the reach of your titles
YUMPU automatically turns print PDFs into web optimized ePapers that Google loves.
254<br />
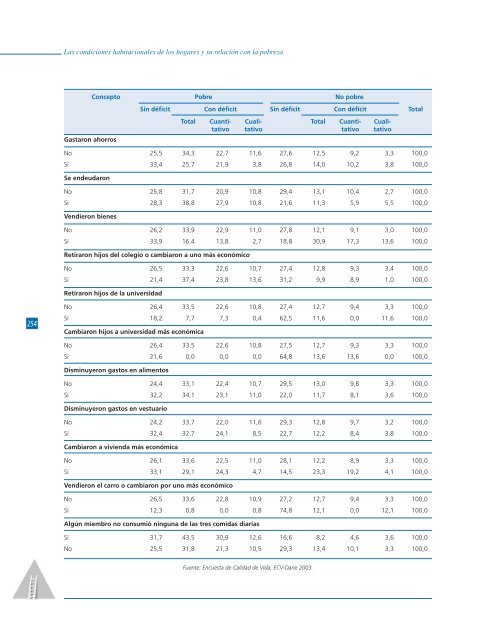
<strong>Las</strong> <strong><strong>con</strong>diciones</strong> <strong>habitacionales</strong> <strong>de</strong> <strong>los</strong> <strong>hogares</strong> y <strong>su</strong> <strong>re<strong>la</strong>ción</strong> <strong>con</strong> <strong>la</strong> pobreza<br />
Gastaron ahorros<br />
No 25,5 34,3 22,7 11,6 27,6 12,5 9,2 3,3 100,0<br />
Sí 33,4 25,7 21,9 3,8 26,8 14,0 10,2 3,8 100,0<br />
Se en<strong>de</strong>udaron<br />
Concepto Pobre No pobre<br />
Sin déficit Con déficit Sin déficit Con déficit Total<br />
Total Cuanti- Cuali- Total Cuanti- Cualitativo<br />
tativo tativo tativo<br />
No 25,8 31,7 20,9 10,8 29,4 13,1 10,4 2,7 100,0<br />
Sí 28,3 38,8 27,9 10,8 21,6 11,3 5,9 5,5 100,0<br />
Vendieron bienes<br />
No 26,2 33,9 22,9 11,0 27,8 12,1 9,1 3,0 100,0<br />
Sí 33,9 16,4 13,8 2,7 18,8 30,9 17,3 13,6 100,0<br />
Retiraron hijos <strong>de</strong>l colegio o cambiaron a uno más e<strong>con</strong>ómico<br />
No 26,5 33,3 22,6 10,7 27,4 12,8 9,3 3,4 100,0<br />
Sí 21,4 37,4 23,8 13,6 31,2 9,9 8,9 1,0 100,0<br />
Retiraron hijos <strong>de</strong> <strong>la</strong> universidad<br />
No 26,4 33,5 22,6 10,8 27,4 12,7 9,4 3,3 100,0<br />
Sí 18,2 7,7 7,3 0,4 62,5 11,6 0,0 11,6 100,0<br />
Cambiaron hijos a universidad más e<strong>con</strong>ómica<br />
No 26,4 33,5 22,6 10,8 27,5 12,7 9,3 3,3 100,0<br />
Sí 21,6 0,0 0,0 0,0 64,8 13,6 13,6 0,0 100,0<br />
Disminuyeron gastos en alimentos<br />
No 24,4 33,1 22,4 10,7 29,5 13,0 9,8 3,3 100,0<br />
Sí 32,2 34,1 23,1 11,0 22,0 11,7 8,1 3,6 100,0<br />
Disminuyeron gastos en vestuario<br />
No 24,2 33,7 22,0 11,6 29,3 12,8 9,7 3,2 100,0<br />
Sí 32,4 32,7 24,1 8,5 22,7 12,2 8,4 3,8 100,0<br />
Cambiaron a vivienda más e<strong>con</strong>ómica<br />
No 26,1 33,6 22,5 11,0 28,1 12,2 8,9 3,3 100,0<br />
Sí 33,1 29,1 24,3 4,7 14,5 23,3 19,2 4,1 100,0<br />
Vendieron el carro o cambiaron por uno más e<strong>con</strong>ómico<br />
No 26,5 33,6 22,8 10,9 27,2 12,7 9,4 3,3 100,0<br />
Sí 12,3 0,8 0,0 0,8 74,8 12,1 0,0 12,1 100,0<br />
Algún miembro no <strong>con</strong><strong>su</strong>mió ninguna <strong>de</strong> <strong>la</strong>s tres comidas diarias<br />
Sí 31,7 43,5 30,9 12,6 16,6 8,2 4,6 3,6 100,0<br />
No 25,5 31,8 21,3 10,5 29,3 13,4 10,1 3,3 100,0<br />
Fuente: Encuesta <strong>de</strong> Calidad <strong>de</strong> Vida, ECV-Dane 2003.