Las condiciones habitacionales de los hogares y su relación con la ...
Las condiciones habitacionales de los hogares y su relación con la ...
Las condiciones habitacionales de los hogares y su relación con la ...

You also want an ePaper? Increase the reach of your titles
YUMPU automatically turns print PDFs into web optimized ePapers that Google loves.
262<br />
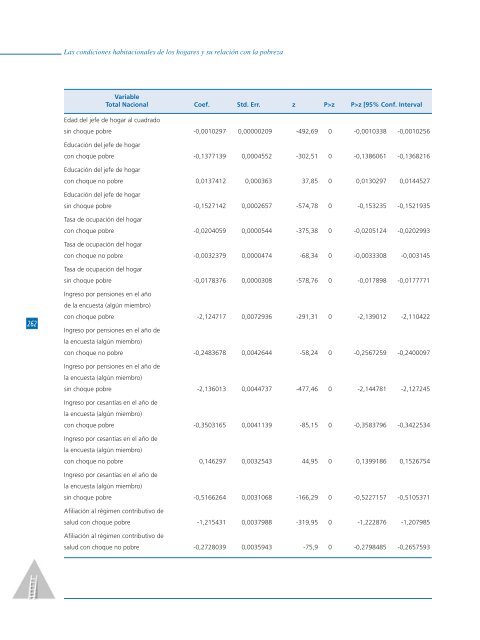
<strong>Las</strong> <strong><strong>con</strong>diciones</strong> <strong>habitacionales</strong> <strong>de</strong> <strong>los</strong> <strong>hogares</strong> y <strong>su</strong> <strong>re<strong>la</strong>ción</strong> <strong>con</strong> <strong>la</strong> pobreza<br />
Edad <strong>de</strong>l jefe <strong>de</strong> hogar al cuadrado<br />
sin choque pobre -0,0010297 0,00000209 -492,69 0 -0,0010338 -0,0010256<br />
Educación <strong>de</strong>l jefe <strong>de</strong> hogar<br />
<strong>con</strong> choque pobre -0,1377139 0,0004552 -302,51 0 -0,1386061 -0,1368216<br />
Educación <strong>de</strong>l jefe <strong>de</strong> hogar<br />
<strong>con</strong> choque no pobre 0,0137412 0,000363 37,85 0 0,0130297 0,0144527<br />
Educación <strong>de</strong>l jefe <strong>de</strong> hogar<br />
sin choque pobre -0,1527142 0,0002657 -574,78 0 -0,153235 -0,1521935<br />
Tasa <strong>de</strong> ocupación <strong>de</strong>l hogar<br />
<strong>con</strong> choque pobre -0,0204059 0,0000544 -375,38 0 -0,0205124 -0,0202993<br />
Tasa <strong>de</strong> ocupación <strong>de</strong>l hogar<br />
<strong>con</strong> choque no pobre -0,0032379 0,0000474 -68,34 0 -0,0033308 -0,003145<br />
Tasa <strong>de</strong> ocupación <strong>de</strong>l hogar<br />
sin choque pobre -0,0178376 0,0000308 -578,76 0 -0,017898 -0,0177771<br />
Ingreso por pensiones en el año<br />
<strong>de</strong> <strong>la</strong> encuesta (algún miembro)<br />
<strong>con</strong> choque pobre -2,124717 0,0072936 -291,31 0 -2,139012 -2,110422<br />
Ingreso por pensiones en el año <strong>de</strong><br />
<strong>la</strong> encuesta (algún miembro)<br />
<strong>con</strong> choque no pobre -0,2483678 0,0042644 -58,24 0 -0,2567259 -0,2400097<br />
Ingreso por pensiones en el año <strong>de</strong><br />
<strong>la</strong> encuesta (algún miembro)<br />
sin choque pobre -2,136013 0,0044737 -477,46 0 -2,144781 -2,127245<br />
Ingreso por cesantías en el año <strong>de</strong><br />
<strong>la</strong> encuesta (algún miembro)<br />
<strong>con</strong> choque pobre -0,3503165 0,0041139 -85,15 0 -0,3583796 -0,3422534<br />
Ingreso por cesantías en el año <strong>de</strong><br />
<strong>la</strong> encuesta (algún miembro)<br />
<strong>con</strong> choque no pobre 0,146297 0,0032543 44,95 0 0,1399186 0,1526754<br />
Ingreso por cesantías en el año <strong>de</strong><br />
<strong>la</strong> encuesta (algún miembro)<br />
Variable<br />
Total Nacional Coef. Std. Err. z P>z P>z [95% Conf. Interval<br />
sin choque pobre -0,5166264 0,0031068 -166,29 0 -0,5227157 -0,5105371<br />
Afiliación al régimen <strong>con</strong>tributivo <strong>de</strong><br />
salud <strong>con</strong> choque pobre -1,215431 0,0037988 -319,95 0 -1,222876 -1,207985<br />
Afiliación al régimen <strong>con</strong>tributivo <strong>de</strong><br />
salud <strong>con</strong> choque no pobre -0,2728039 0,0035943 -75,9 0 -0,2798485 -0,2657593