Las condiciones habitacionales de los hogares y su relación con la ...
Las condiciones habitacionales de los hogares y su relación con la ...
Las condiciones habitacionales de los hogares y su relación con la ...

You also want an ePaper? Increase the reach of your titles
YUMPU automatically turns print PDFs into web optimized ePapers that Google loves.
50<br />
<strong>Las</strong> <strong><strong>con</strong>diciones</strong> <strong>habitacionales</strong> <strong>de</strong> <strong>los</strong> <strong>hogares</strong> y <strong>su</strong> <strong>re<strong>la</strong>ción</strong> <strong>con</strong> <strong>la</strong> pobreza<br />
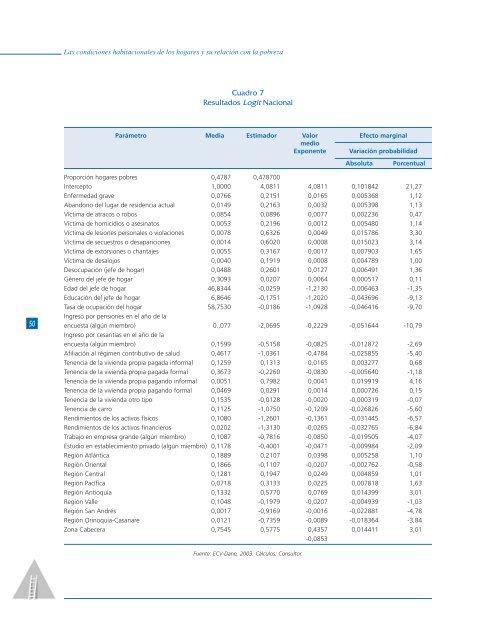
Cuadro 7<br />
Re<strong>su</strong>ltados Logit Nacional<br />
Parámetro Media Estimador Valor Efecto marginal<br />
medio<br />
Exponente Variación probabilidad<br />
Absoluta Porcentual<br />
Proporción <strong>hogares</strong> pobres 0,4787 0,478700<br />
Intercepto 1,0000 4,0811 4,0811 0,101842 21,27<br />
Enfermedad grave 0,0766 0,2151 0,0165 0,005368 1,12<br />
Abandono <strong>de</strong>l lugar <strong>de</strong> resi<strong>de</strong>ncia actual 0,0149 0,2163 0,0032 0,005398 1,13<br />
Víctima <strong>de</strong> atracos o robos 0,0854 0,0896 0,0077 0,002236 0,47<br />
Víctima <strong>de</strong> homicidios o asesinatos 0,0053 0,2196 0,0012 0,005480 1,14<br />
Víctima <strong>de</strong> lesiones personales o vio<strong>la</strong>ciones 0,0078 0,6326 0,0049 0,015786 3,30<br />
Víctima <strong>de</strong> secuestros o <strong>de</strong>sapariciones 0,0014 0,6020 0,0008 0,015023 3,14<br />
Víctima <strong>de</strong> extorsiones o chantajes 0,0055 0,3167 0,0017 0,007903 1,65<br />
Víctima <strong>de</strong> <strong>de</strong>salojos 0,0040 0,1919 0,0008 0,004789 1,00<br />
Desocupación (jefe <strong>de</strong> hogar) 0,0488 0,2601 0,0127 0,006491 1,36<br />
Género <strong>de</strong>l jefe <strong>de</strong> hogar 0,3093 0,0207 0,0064 0,000517 0,11<br />
Edad <strong>de</strong>l jefe <strong>de</strong> hogar 46,8344 -0,0259 -1,2130 -0,006463 -1,35<br />
Educación <strong>de</strong>l jefe <strong>de</strong> hogar 6,8646 -0,1751 -1,2020 -0,043696 -9,13<br />
Tasa <strong>de</strong> ocupación <strong>de</strong>l hogar 58,7530 -0,0186 -1,0928 -0,046416 -9,70<br />
Ingreso por pensiones en el año <strong>de</strong> <strong>la</strong><br />
encuesta (algún miembro) 0.,077 -2,0695 -0,2229 -0,051644 -10,79<br />
Ingreso por cesantías en el año <strong>de</strong> <strong>la</strong><br />
encuesta (algún miembro) 0,1599 -0,5158 -0,0825 -0,012872 -2,69<br />
Afiliación al régimen <strong>con</strong>tributivo <strong>de</strong> salud 0,4617 -1,0361 -0,4784 -0,025855 -5,40<br />
Tenencia <strong>de</strong> <strong>la</strong> vivienda propia pagada informal 0,1259 0,1313 0,0165 0,003277 0,68<br />
Tenencia <strong>de</strong> <strong>la</strong> vivienda propia pagada formal 0,3673 -0,2260 -0,0830 -0,005640 -1,18<br />
Tenencia <strong>de</strong> <strong>la</strong> vivienda propia pagando informal 0,0051 0,7982 0,0041 0,019919 4,16<br />
Tenencia <strong>de</strong> <strong>la</strong> vivienda propia pagando formal 0,0469 0,0291 0,0014 0,000726 0,15<br />
Tenencia <strong>de</strong> <strong>la</strong> vivienda otro tipo 0,1535 -0,0128 -0,0020 -0,000319 -0,07<br />
Tenencia <strong>de</strong> carro 0,1125 -1,0750 -0,1209 -0,026826 -5,60<br />
Rendimientos <strong>de</strong> <strong>los</strong> activos físicos 0,1080 -1,2601 -0,1361 -0,031445 -6,57<br />
Rendimientos <strong>de</strong> <strong>los</strong> activos financieros 0,0202 -1,3130 -0,0265 -0,032765 -6,84<br />
Trabajo en empresa gran<strong>de</strong> (algún miembro) 0,1087 -0,7816 -0,0850 -0,019505 -4,07<br />
Estudio en establecimiento privado (algún miembro) 0,1178 -0,4001 -0,0471 -0,009984 -2,09<br />
Región Atlántica 0,1889 0,2107 0,0398 0,005258 1,10<br />
Región Oriental 0,1866 -0,1107 -0,0207 -0,002762 -0,58<br />
Región Central 0,1281 0,1947 0,0249 0,004859 1,01<br />
Región Pacífica 0,0718 0,3133 0,0225 0,007818 1,63<br />
Región Antioquia 0,1332 0,5770 0,0769 0,014399 3,01<br />
Región Valle 0,1048 -0,1979 -0,0207 -0,004939 -1,03<br />
Región San Andrés 0,0017 -0,9169 -0,0016 -0,022881 -4,78<br />
Región Orinoquia-Casanare 0,0121 -0,7359 -0,0089 -0,018364 -3,84<br />
Zona Cabecera 0,7545 0,5775 0,4357 0,014411 3,01<br />
-0,0853<br />
Fuente: ECV-Dane, 2003. Cálcu<strong>los</strong>: Con<strong>su</strong>ltor.