Las condiciones habitacionales de los hogares y su relación con la ...
Las condiciones habitacionales de los hogares y su relación con la ...
Las condiciones habitacionales de los hogares y su relación con la ...

You also want an ePaper? Increase the reach of your titles
YUMPU automatically turns print PDFs into web optimized ePapers that Google loves.
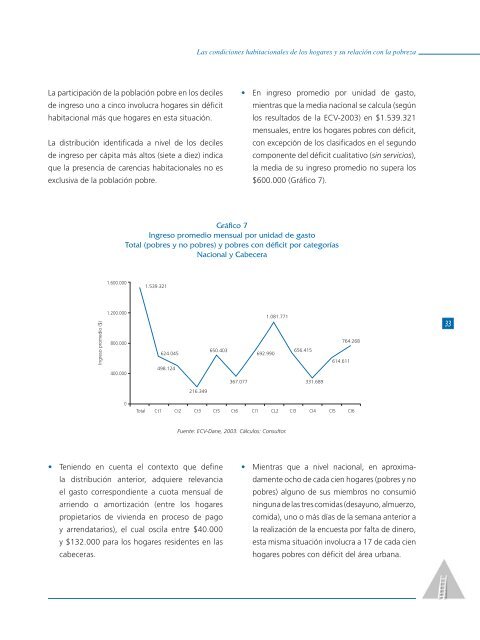
La participación <strong>de</strong> <strong>la</strong> pob<strong>la</strong>ción pobre en <strong>los</strong> <strong>de</strong>ciles<br />
<strong>de</strong> ingreso uno a cinco involucra <strong>hogares</strong> sin déficit<br />
habitacional más que <strong>hogares</strong> en esta situación.<br />
La distribución i<strong>de</strong>ntificada a nivel <strong>de</strong> <strong>los</strong> <strong>de</strong>ciles<br />
<strong>de</strong> ingreso per cápita más altos (siete a diez) indica<br />
que <strong>la</strong> presencia <strong>de</strong> carencias <strong>habitacionales</strong> no es<br />
exclusiva <strong>de</strong> <strong>la</strong> pob<strong>la</strong>ción pobre.<br />
Ingreso promedio ($)<br />
1.600.000<br />
1.200.000<br />
800.000<br />
400.000<br />
<strong>Las</strong> <strong><strong>con</strong>diciones</strong> <strong>habitacionales</strong> <strong>de</strong> <strong>los</strong> <strong>hogares</strong> y <strong>su</strong> <strong>re<strong>la</strong>ción</strong> <strong>con</strong> <strong>la</strong> pobreza<br />
Fuente: ECV-Dane, 2003. Cálcu<strong>los</strong>: Con<strong>su</strong>ltor.<br />
• En ingreso promedio por unidad <strong>de</strong> gasto,<br />
mientras que <strong>la</strong> media nacional se calcu<strong>la</strong> (según<br />
<strong>los</strong> re<strong>su</strong>ltados <strong>de</strong> <strong>la</strong> ECV-2003) en $1.539.321<br />
men<strong>su</strong>ales, entre <strong>los</strong> <strong>hogares</strong> pobres <strong>con</strong> déficit,<br />
<strong>con</strong> excepción <strong>de</strong> <strong>los</strong> c<strong>la</strong>sificados en el segundo<br />
componente <strong>de</strong>l déficit cualitativo (sin servicios),<br />
<strong>la</strong> media <strong>de</strong> <strong>su</strong> ingreso promedio no <strong>su</strong>pera <strong>los</strong><br />
$600.000 (Gráfico 7).<br />
Gráfico 7<br />
Ingreso promedio men<strong>su</strong>al por unidad <strong>de</strong> gasto<br />
Total (pobres y no pobres) y pobres <strong>con</strong> déficit por categorías<br />
Nacional y Cabecera<br />
0<br />
1.539.321<br />
624.045<br />
498.124<br />
216.349<br />
650.403<br />
• Teniendo en cuenta el <strong>con</strong>texto que <strong>de</strong>fine<br />
367.077<br />
692.990<br />
1.081.771<br />
656.415<br />
331.689<br />
614.611<br />
764.268<br />
Total Ct1 Ct2 Ct3 Ct5 Ct6 CI1 CL2 CI3 CI4 CI5 CI6<br />
<strong>la</strong> distribución anterior, adquiere relevancia<br />
el gasto correspondiente a cuota men<strong>su</strong>al <strong>de</strong><br />
arriendo o amortización (entre <strong>los</strong> <strong>hogares</strong><br />
propietarios <strong>de</strong> vivienda en proceso <strong>de</strong> pago<br />
y arrendatarios), el cual osci<strong>la</strong> entre $40.000<br />
y $132.000 para <strong>los</strong> <strong>hogares</strong> resi<strong>de</strong>ntes en <strong>la</strong>s<br />
cabeceras.<br />
• Mientras que a nivel nacional, en aproxima-<br />
damente ocho <strong>de</strong> cada cien <strong>hogares</strong> (pobres y no<br />
pobres) alguno <strong>de</strong> <strong>su</strong>s miembros no <strong>con</strong><strong>su</strong>mió<br />
ninguna <strong>de</strong> <strong>la</strong>s tres comidas (<strong>de</strong>sayuno, almuerzo,<br />
comida), uno o más días <strong>de</strong> <strong>la</strong> semana anterior a<br />
<strong>la</strong> realización <strong>de</strong> <strong>la</strong> encuesta por falta <strong>de</strong> dinero,<br />
esta misma situación involucra a 17 <strong>de</strong> cada cien<br />
<strong>hogares</strong> pobres <strong>con</strong> déficit <strong>de</strong>l área urbana.<br />
33