Indonesia: El Mercado de Equipos y Componentes para ... - OMEGA
Indonesia: El Mercado de Equipos y Componentes para ... - OMEGA
Indonesia: El Mercado de Equipos y Componentes para ... - OMEGA

Create successful ePaper yourself
Turn your PDF publications into a flip-book with our unique Google optimized e-Paper software.
INDONESIA:EL MERCADO DE EQUIPOS Y<br />
COMPONENTES PARA AUTOMOCION<br />
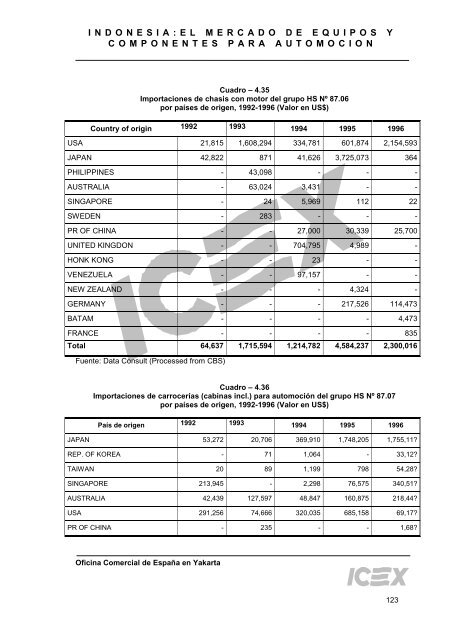
Cuadro – 4.35<br />
Importaciones <strong>de</strong> chasis con motor <strong>de</strong>l grupo HS Nº 87.06<br />
por países <strong>de</strong> origen, 1992-1996 (Valor en US$)<br />
Country of origin 1992 1993 1994 1995 1996<br />
USA 21,815 1,608,294 334,781 601,874 2,154,593<br />
JAPAN 42,822 871 41,626 3,725,073 364<br />
PHILIPPINES - 43,098 - - -<br />
AUSTRALIA - 63,024 3,431 - -<br />
SINGAPORE - 24 5,969 112 22<br />
SWEDEN - 283 - - -<br />
PR OF CHINA - - 27,000 30,339 25,700<br />
UNITED KINGDON - - 704,795 4,989 -<br />
HONK KONG - - 23 - -<br />
VENEZUELA - - 97,157 - -<br />
NEW ZEALAND - - - 4,324 -<br />
GERMANY - - - 217,526 114,473<br />
BATAM - - - - 4,473<br />
FRANCE - - - - 835<br />
Total 64,637 1,715,594 1,214,782 4,584,237 2,300,016<br />
Fuente: Data Consult (Processed from CBS)<br />
Cuadro – 4.36<br />
Importaciones <strong>de</strong> carrocerías (cabinas incl.) <strong>para</strong> automoción <strong>de</strong>l grupo HS Nº 87.07<br />
por países <strong>de</strong> origen, 1992-1996 (Valor en US$)<br />
País <strong>de</strong> origen 1992 1993 1994 1995 1996<br />
JAPAN 53,272 20,706 369,910 1,748,205 1,755,11<br />
REP. OF KOREA - 71 1,064 - 33,12<br />
TAIWAN 20 89 1,199 798 54,28<br />
SINGAPORE 213,945 - 2,298 76,575 340,51<br />
AUSTRALIA 42,439 127,597 48,847 160,875 218,44<br />
USA 291,256 74,666 320,035 685,158 69,17<br />
PR OF CHINA - 235 - - 1,68<br />
Oficina Comercial <strong>de</strong> España en Yakarta<br />
123