Indonesia: El Mercado de Equipos y Componentes para ... - OMEGA
Indonesia: El Mercado de Equipos y Componentes para ... - OMEGA
Indonesia: El Mercado de Equipos y Componentes para ... - OMEGA

Create successful ePaper yourself
Turn your PDF publications into a flip-book with our unique Google optimized e-Paper software.
INDONESIA:EL MERCADO DE EQUIPOS Y<br />
COMPONENTES PARA AUTOMOCION<br />
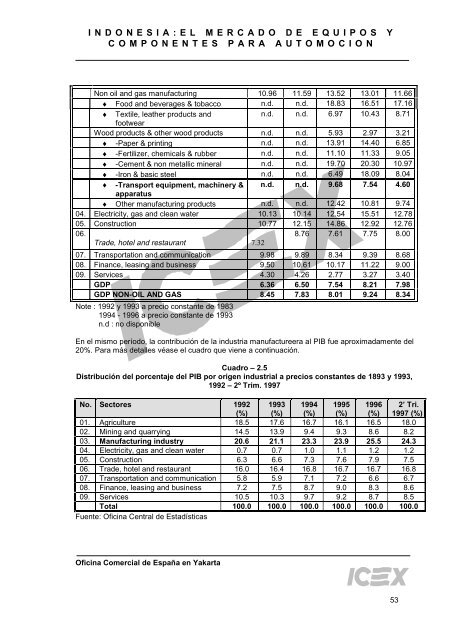
Non oil and gas manufacturing 10.96 11.59 13.52 13.01 11.66<br />
♦ Food and beverages & tobacco n.d. n.d. 18.83 16.51 17.16<br />
♦ Textile, leather products and<br />
n.d. n.d. 6.97 10.43 8.71<br />
footwear<br />
Wood products & other wood products n.d. n.d. 5.93 2.97 3.21<br />
♦ -Paper & printing n.d. n.d. 13.91 14.40 6.85<br />
♦ -Fertilizer, chemicals & rubber n.d. n.d. 11.10 11.33 9.05<br />
♦ -Cement & non metallic mineral n.d. n.d. 19.70 20.30 10.97<br />
♦ -Iron & basic steel n.d. n.d. 6.49 18.09 8.04<br />
♦ -Transport equipment, machinery & n.d. n.d. 9.68 7.54 4.60<br />
ap<strong>para</strong>tus<br />
♦ Other manufacturing products n.d. n.d. 12.42 10.81 9.74<br />
04. <strong>El</strong>ectricity, gas and clean water 10.13 10.14 12.54 15.51 12.78<br />
05. Construction 10.77 12.15 14.86 12.92 12.76<br />
06.<br />
Tra<strong>de</strong>, hotel and restaurant 7.32<br />
8.76 7.61 7.75 8.00<br />
07. Transportation and communication 9.98 9.89 8.34 9.39 8.68<br />
08. Finance, leasing and business 9.50 10.61 10.17 11.22 9.00<br />
09. Services 4.30 4.26 2.77 3.27 3.40<br />
GDP 6.36 6.50 7.54 8.21 7.98<br />
GDP NON-OIL AND GAS 8.45 7.83 8.01 9.24 8.34<br />
Note : 1992 y 1993 a precio constante <strong>de</strong> 1983<br />
1994 - 1996 a precio constante <strong>de</strong> 1993<br />
n.d : no disponible<br />
En el mismo período, la contribución <strong>de</strong> la industria manufactureera al PIB fue aproximadamente <strong>de</strong>l<br />
20%. Para más <strong>de</strong>talles véase el cuadro que viene a continuación.<br />
Cuadro – 2.5<br />
Distribución <strong>de</strong>l porcentaje <strong>de</strong>l PIB por origen industrial a precios constantes <strong>de</strong> 1893 y 1993,<br />
1992 – 2º Trim. 1997<br />
No. Sectores 1992<br />
(%)<br />
1993<br />
(%)<br />
1994<br />
(%)<br />
1995<br />
(%)<br />
1996<br />
(%)<br />
2’ Tri.<br />
1997 (%)<br />
01. Agriculture 18.5 17.6 16.7 16.1 16.5 18.0<br />
02. Mining and quarrying 14.5 13.9 9.4 9.3 8.6 8.2<br />
03. Manufacturing industry 20.6 21.1 23.3 23.9 25.5 24.3<br />
04. <strong>El</strong>ectricity, gas and clean water 0.7 0.7 1.0 1.1 1.2 1.2<br />
05. Construction 6.3 6.6 7.3 7.6 7.9 7.5<br />
06. Tra<strong>de</strong>, hotel and restaurant 16.0 16.4 16.8 16.7 16.7 16.8<br />
07. Transportation and communication 5.8 5.9 7.1 7.2 6.6 6.7<br />
08. Finance, leasing and business 7.2 7.5 8.7 9.0 8.3 8.6<br />
09. Services 10.5 10.3 9.7 9.2 8.7 8.5<br />
Total 100.0 100.0 100.0 100.0 100.0 100.0<br />
Fuente: Oficina Central <strong>de</strong> Estadísticas<br />
Oficina Comercial <strong>de</strong> España en Yakarta<br />
53