- Page 1 and 2: INFORME ANUAL200
- Page 3 and 4: INFORME ANUAL 2009
- Page 5 and 6: SIGLAS, ABREVIATURAS Y SIGNOS UTILI
- Page 9: 1 RASGOS BÁSICOS
- Page 13 and 14: dar ya en el seno del G 20 y del Co
- Page 15 and 16: ... teniendo que realizarse en unco
- Page 18 and 19: La economía españolaexperimentó
- Page 20 and 21: DIFERENCIAL DE INFLACIÓN DE ESPAÑ
- Page 22 and 23: en el que la calidad de las estadí
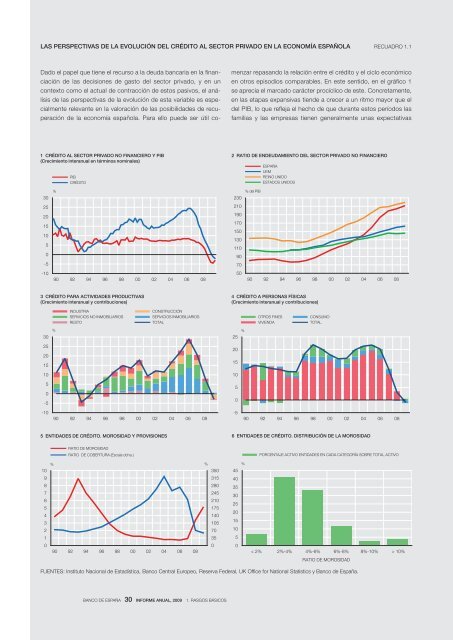
- Page 26 and 27: LAS PERSPECTIVAS DE LA EVOLUCIÓN D
- Page 28: 4.4 LA CAÍDA DEL GASTOINTERNOLa co
- Page 31: AJUSTE FISCAL Y DINÁMICA DE LA DEU
- Page 35 and 36: La crisis y el crecimiento potencia
- Page 37 and 38: INTENSIDAD DE CAPITAL EN RELACIÓN
- Page 39 and 40: LA DESAPARICIÓN DE EMPRESAS EN ESP
- Page 41 and 42: LA DESAPARICIÓN DE EMPRESAS EN ESP
- Page 43 and 44: crisis, sin embargo, la tasa de act
- Page 45 and 46: Dado que los rendimientos salariale
- Page 47 and 48: EFECTOS EN EL LARGO PLAZO DEL DESEM
- Page 49 and 50: INDICADORES DE CAPITAL TECNOLÓGICO
- Page 51 and 52: DESCOMPOSICIÓN DEL CRECIMIENTO ECO
- Page 53 and 54: PRODUCTIVIDAD DEL TRABAJO Y PRODUCT
- Page 55 and 56: diferentes instrumentos contraria a
- Page 57 and 58: 3 EL ENTORNO EXTERIOR DEL ÁREA DEL
- Page 59 and 60: PRINCIPALES INDICADORES MACROECONÓ
- Page 61 and 62: PRODUCCIÓN INDUSTRIAL Y COMERCIO I
- Page 63 and 64: 2 Evolución económicay financiera
- Page 65 and 66: ACTIVIDAD ECONÓMICA Y EMPLEO GRÁF
- Page 67 and 68: POLÍTICA MONETARIA Y FISCAL GRÁFI
- Page 69 and 70: LA ACTUACIÓN DE LOS BANCOS CENTRAL
- Page 71 and 72: TIPOS DE CAMBIO Y FLUJOS DE CAPITAL
- Page 73: FINANCIACIÓN DEL SECTOR PRIVADO GR
- Page 76 and 77:
en el apetito por el riesgo y a la
- Page 78 and 79:
EL NUEVO MARCO DE COORDINACIÓN DE
- Page 80 and 81:
La recomposición de balancesdel se
- Page 82 and 83:
actividad en la parte final de 2009
- Page 84 and 85:
Pero también es esencialel manteni
- Page 86 and 87:
El área del euro y la política mo
- Page 88 and 89:
UEM: COMPOSICIÓN DEL CRECIMIENTO G
- Page 90 and 91:
FINANCIACIÓN AL SECTOR PRIVADO GR
- Page 92 and 93:
3 La mejora de lascondiciones finan
- Page 94 and 95:
UEM: POLÍTICA FISCALGRÁFICO 4.6SA
- Page 96 and 97:
LOS DIFERENCIALES DE LA DEUDA SOBER
- Page 98 and 99:
HOLGURA DE LAS CONDICIONES ECONÓMI
- Page 100 and 101:
Más concretamente, no se pueden mi
- Page 102 and 103:
LA CONSOLIDACIÓN FISCAL EN LOS PA
- Page 104 and 105:
PRINCIPALES INDICADORES ESTRUCTURAL
- Page 106 and 107:
crisis de la deuda pública griega.
- Page 108 and 109:
La economía españolaLa recesión
- Page 110 and 111:
1 Las condicionesmonetarias y finan
- Page 112 and 113:
PRINCIPALES MEDIDAS DE ESTÍMULO AP
- Page 114 and 115:
minación parcial de la deducción
- Page 116 and 117:
Por su parte, el Plan de Vivienda 2
- Page 118 and 119:
CONSUMO FINAL DE LOS HOGARES GRÁFI
- Page 120 and 121:
TÍTULO EL AJUSTE RECUADRO DEL SECT
- Page 122 and 123:
INVERSIÓN EN VIVIENDA E INVERSIÓN
- Page 124 and 125:
DEMANDA EXTERIOR Y PRINCIPALES DETE
- Page 126 and 127:
VAB Y EMPLEO POR RAMAS DE ACTIVIDAD
- Page 128 and 129:
se tradujo en aumentos muy altos de
- Page 130 and 131:
DETERMINANTES DE LA EVOLUCIÓN DE L
- Page 132 and 133:
TÍTULO LA CORRECCIÓN RECUADRO DEL
- Page 134 and 135:
CUENTA DEL RESTO DEL MUNDO GRÁFICO
- Page 136 and 137:
La evolución financiera en España
- Page 138 and 139:
Este aumento de la morosidad está
- Page 140 and 141:
MEDIDAS DE APOYO A LAS ENTIDADES DE
- Page 142 and 143:
EMISIONES Y OFERTAS PÚBLICAS DE VA
- Page 144 and 145:
PRECIOS NEGOCIADOS EN LOS MERCADOS
- Page 146 and 147:
... la fuerte competencia en lacapt
- Page 148 and 149:
entidades de seguros y fondos de pe
- Page 150 and 151:
LA POSICIÓN PATRIMONIAL DEL SECTOR
- Page 152 and 153:
FINANCIACIÓN DE LAS SOCIEDADES NO
- Page 154 and 155:
OPERACIONES FINANCIERAS NETAS(Evolu
- Page 156 and 157:
Las entradas de capitalse canalizar
- Page 158 and 159:
Informe de gestión del Banco de Es
- Page 160 and 161:
mercado para la compensación y liq
- Page 162 and 163:
— Asesoramiento técnico a la Com
- Page 164 and 165:
En 2009, el Banco mantuvo su estrec
- Page 166 and 167:
política económica, las implicaci
- Page 168 and 169:
nes de inflación en países emerge
- Page 170 and 171:
Durante 2009 la actividad superviso
- Page 172 and 173:
A ello hay que añadir que la activ
- Page 174 and 175:
5.3.1 Cambios normativosLos cambios
- Page 176 and 177:
te en la revisión de las guías so
- Page 178 and 179:
ancario europeo. Así, las entidade
- Page 180 and 181:
debido a la entrada de billetes pro
- Page 182 and 183:
7.1.1 Estadísticas monetariasy fin
- Page 184 and 185:
encuentros informativos para presen
- Page 186 and 187:
curso (2010-2011), se llevará a ca
- Page 188 and 189:
últimos ejercicios en cuanto a las
- Page 190 and 191:
servicio a disposición de los ciud
- Page 192 and 193:
participamos, así como del coste d
- Page 194 and 195:
1 IntroducciónLas cuentas anuales
- Page 196 and 197:
BALANCE DEL BANCO DE ESPAÑA A 31 D
- Page 198 and 199:
3 Memoria explicativa3.1 Normativa
- Page 200 and 201:
Los valores de la cartera de negoci
- Page 202 and 203:
El coste de adquisición de un inmo
- Page 204 and 205:
Reconocimiento de ingresosy gastosL
- Page 206 and 207:
FMI correspondientes a préstamos c
- Page 208 and 209:
proporción a su participación en
- Page 210 and 211:
ción de dichos márgenes. Estas cu
- Page 212 and 213:
10 CUENTAS INTRA-EUROSISTEMAEsta r
- Page 214 and 215:
c. Activos netos relacionadoscon la
- Page 216 and 217:
En millones de eurosINTERESES DEVEN
- Page 218 and 219:
Los restantes epígrafes incluidos
- Page 220 and 221:
Finalmente, por lo que se refiere a
- Page 222 and 223:
En millones de eurosPara la cobertu
- Page 224 and 225:
mento de su precio de mercado (ha p
- Page 226 and 227:
media obtenida este ejercicio (ha p
- Page 228 and 229:
En millones de euros2009 2008 Varia
- Page 230 and 231:
con la asignación de billetes en e
- Page 232 and 233:
mujeres en 28 efectivos, lo que, ju
- Page 234 and 235:
euros, el ingreso que se efectuó a
- Page 236 and 237:
del calendario de amortización ori
- Page 238 and 239:
BANCO DE ESPAÑA 256 INFORME ANUAL,
- Page 240 and 241:
ANEJO LEGISLATIVO
- Page 242 and 243:
1 Principales normas relativas al s
- Page 244 and 245:
en cada Estado miembro participante
- Page 246 and 247:
para lo cual se establece una clasi
- Page 248 and 249:
BANCO CENTRAL EUROPEO: ESTADÍSTICA
- Page 250 and 251:
dimientos de la política monetaria
- Page 252 and 253:
y los niveles de deuda pública pre
- Page 254 and 255:
preceptos de la normativa regulador
- Page 256 and 257:
Por último, se sustituye la habili
- Page 258 and 259:
permanente de las calificaciones cr
- Page 260 and 261:
Asimismo, la norma recoge una ampli
- Page 262 and 263:
to 948/2001, de 3 de agosto, sobre
- Page 264 and 265:
Finalmente, se actualiza el régime
- Page 266 and 267:
UEM.1 (balance resumido) un activo
- Page 268 and 269:
2 Índice sistemático de materias
- Page 270 and 271:
MATERIAS5 NORMAS FISCALES Y OTRAS M
- Page 272 and 273:
Índice de cuadrosCuadro 1.1 Princi
- Page 274 and 275:
Gráfico 6.3 Inversores institucion
- Page 276 and 277:
COMPOSICIÓN DE LOS ÓRGANOS DE GOB
- Page 278 and 279:
Consejo de GobiernoGOBERNADORMiguel
- Page 280 and 281:
PUBLICACIONES DEL BANCO DE ESPAÑAE
- Page 282 and 283:
0925 ÁNGEL ESTRADA Y JOSÉ MANUEL