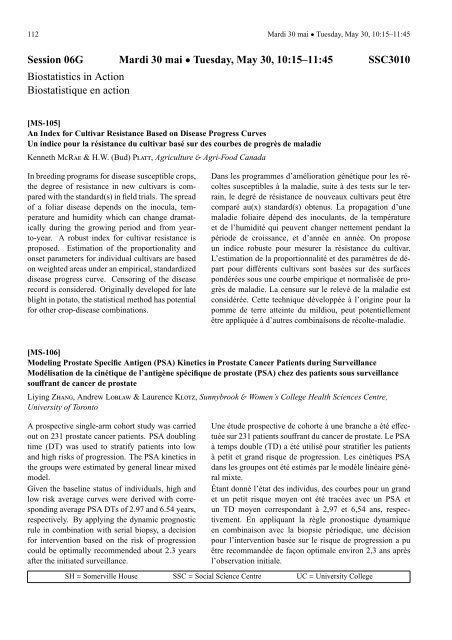
112 Mardi 30 mai • Tuesday, May 30, 10:15–11:45Session 06G Mardi 30 mai • Tuesday, May 30, 10:15–11:45 SSC3010Biostatistics in ActionBio<strong>statistique</strong> en action[MS-105]An Index for Cultivar Resistance Based on Disease Progress CurvesUn indice pour la résistance <strong>du</strong> cultivar basé sur des courbes de progrès de maladieKenn<strong>et</strong>h MCRAE & H.W. (Bud) PLATT, Agriculture & Agri-Food <strong>Canada</strong>In breeding programs for disease susceptible crops,the degree of resistance in new cultivars is com-Dans les programmes d’amélioration génétique pour les récoltessusceptibles à la maladie, suite à des tests sur le terparedwith the standard(s) in field trials. The spread rain, le degré de résistance de nouveaux cultivars peut êtreof a foliar disease depends on the inocula, tem- comparé au(x) standard(s) obtenus. La propagation d’uneperature and humidity which can change dramat- maladie foliaire dépend des inoculants, de la températureically <strong>du</strong>ring the growing period and from year- <strong>et</strong> de l’humidité qui peuvent changer n<strong>et</strong>tement pendant lato-year. A robust index for cultivar resistance is période de croissance, <strong>et</strong> d’année en année. On proposeproposed. Estimation of the proportionality and un indice robuste pour mesurer la résistance <strong>du</strong> cultivar.ons<strong>et</strong> param<strong>et</strong>ers for indivi<strong>du</strong>al cultivars are based L’estimation de la proportionnalité <strong>et</strong> des paramètres de déonweighted areas under an empirical, standardized part pour différents cultivars sont basées sur des surfacesdisease progress curve. Censoring of the disease pondérées sous une courbe empirique <strong>et</strong> normalisée de prorecordis considered. Originally developed for late grès de maladie. La censure sur le relevé de la maladie estblight in potato, the statistical m<strong>et</strong>hod has potential considérée. C<strong>et</strong>te technique développée à l’origine pour lafor other crop-disease combinations.pomme de terre atteinte <strong>du</strong> mildiou, peut potentiellementêtre appliquée à d’autres combinaisons de récolte-maladie.[MS-106]Modeling Prostate Specific Antigen (PSA) Kin<strong>et</strong>ics in Prostate Cancer Patients <strong>du</strong>ring SurveillanceModélisation de la cinétique de l’antigène spécifique de prostate (PSA) chez des patients sous surveillancesouffrant de cancer de prostateLiying ZHANG, Andrew LOBLAW & Laurence KLOTZ, Sunnybrook & Women’s College Health Sciences Centre,University of TorontoUne étude prospective de cohorte à une branche a été effectuéesur 231 patients souffrant <strong>du</strong> cancer de prostate. Le PSAà temps double (TD) a été utilisé pour stratifier les patientsà p<strong>et</strong>it <strong>et</strong> grand risque de progression. Les cinétiques PSAdans les groupes ont été estimés par le modèle linéaire géné-ral mixte.Étant donné l’état des indivi<strong>du</strong>s, des courbes pour un grand<strong>et</strong> un p<strong>et</strong>it risque moyen ont été tracées avec un PSA <strong>et</strong>un TD moyen correspondant à 2,97 <strong>et</strong> 6,54 ans, respec-tivement. En appliquant la règle pronostique dynamiqueen combinaison avec la biopsie périodique, une décisionpour l’intervention basée sur le risque de progression a puêtre recommandée de façon optimale environ 2,3 ans aprèsl’observation initiale.A prospective single-arm cohort study was carriedout on 231 prostate cancer patients. PSA doublingtime (DT) was used to stratify patients into lowand high risks of progression. The PSA kin<strong>et</strong>ics inthe groups were estimated by general linear mixedmodel.Given the baseline status of indivi<strong>du</strong>als, high andlow risk average curves were derived with correspondingaverage PSA DTs of 2.97 and 6.54 years,respectively. By applying the dynamic prognosticrule in combination with serial biopsy, a decisionfor intervention based on the risk of progressioncould be optimally recommended about 2.3 yearsafter the initiated surveillance.SH = Somerville House SSC = Social Science Centre UC = University College
Mardi 30 mai • Tuesday, May 30, 10:15–11:45 113[MS-107]Modeling Lung Disease and its Progression in a Chronic Obstructive Pulmonary Disease CohortModélisation d’une maladie pulmonaire <strong>et</strong> sa progression au sein d’une cohorte obstructive chroniqueLiqin XU & Marek SMIEJA, McMaster University, Lehana THABANE, McMaster University, Centre for Evaluation ofMedicines, St Joseph’s HealthcareChronic obstructive pulmonary disease (COPD) isa common, irreversible, slowly progressive lungLa maladie pulmonaire obstructive chronique (MPOC) estune affection pulmonaire fréquente, irréversible <strong>et</strong> lentedisease,usually associated with smoking and with ment progressive, habituellement liée au tabagisme <strong>et</strong> auxrespiratory infections. The objective of the study infections respiratoires. L’objectif de l’étude était d’étudierwas to investigate the association b<strong>et</strong>ween lung l’association entre le fonctionnement des poumons <strong>et</strong> plufunctionand several patient characteristics that in- sieurs caractéristiques des patients qui incluent l’âge, leclude age, gender and height. This presentation sexe <strong>et</strong> la taille. C<strong>et</strong>te présentation discutera les résultats dewill discuss the results of analysis to model the re- l’analyse pour modéliser la relation entre le déclin <strong>du</strong> fonclationshipb<strong>et</strong>ween lung function decline and age, tionnement des poumons <strong>et</strong> l’âge, le sexe, la taille, le tabagender,height, smoking and Chlamydia pneumo- gisme <strong>et</strong> l’infection Chlamydia pneumoniae. Nous companiaeinfection. We compare the results based on rons les résultats basés sur des équations d’estimations gégeneralizedestimating equations, random effects néralisées, des eff<strong>et</strong>s aléatoires <strong>et</strong> des modèles robustes deand robust regression models. We will also discuss régression. Nous discuterons également quelques résultatssome results based on different imputation m<strong>et</strong>hods basés sur différentes méthodes d’imputation pour manipulerto handle missing data.des données manquantes.[MS-108]A M<strong>et</strong>a-analysis on Bleeding and Cardiovascular OutcomesUne méta-analyse sur le saignement <strong>et</strong> les résultats cardiovasculairesJi CHENG, Jack SUN & Richard WHITLOCK, McMaster University, Lehana THABANE, Centre for Evaluation ofMedicines, St. Joseph Healthcare & McMaster UniversityDespite guidelines recommending that aspirin bediscontinued seven days prior to coronary bypassEn dépit des directives recommandant que l’absorptiond’aspirine soit cessée pendant sept jours avant un pontagesurgery, many cardiac surgeons continue to keep coronarien, beaucoup de chirurgiens cardiaques continuenttheir patients on aspirin until the day of surgery. à garder leurs patients sur l’aspirine jusqu’au jour de la chi-This may be <strong>du</strong>e to conflicting evidence surround- rurgie. Ceci peut être dû aux preuves contradictoires entouingits effects. The objective of this study was rant ses eff<strong>et</strong>s. L’objectif de c<strong>et</strong>te étude était d’accomplir un<strong>et</strong>o perform a systematic review and to summarize révision systématique <strong>et</strong> de récapituler la preuve sur l’eff<strong>et</strong>the evidence on the effect of preoperative ASA on de l’aspirine avant l’opération sur les conditions de saignebleedingand transfusion requirements in coronary ment <strong>et</strong> de transfusion <strong>du</strong>rant la chirurgie. Dans c<strong>et</strong>te prébypasssurgery. In this presentation, we discuss the sentation, nous discutons les résultats de la méta-analyse desresults of the m<strong>et</strong>a-analysis of both RCT and non- études RCT <strong>et</strong> non-RCT en employant des approches à eff<strong>et</strong>sRCT studies using both fixed and random-effects aléatoires <strong>et</strong> des approches à eff<strong>et</strong>s fixes pour déterminer lesapproaches to d<strong>et</strong>ermine the relevant clinical end- critères d’évaluations cliniques pertinents.points.SH = Somerville House SSC = Social Science Centre UC = University College
- Page 1 and 2:
3Table of Contents • Table des ma
- Page 3 and 4:
Welcome • Bienvenue 5détails sur
- Page 5 and 6:
7Organizers • OrganisateursLocal
- Page 7 and 8:
General Information • Information
- Page 9 and 10:
General Information • Information
- Page 12 and 13:
14 Committees and Meetings • Comi
- Page 14 and 15:
16 Committees and Meetings • Comi
- Page 16 and 17:
18 List of Sessions • Liste des s
- Page 18 and 19:
20 List of Sessions • Liste des s
- Page 20 and 21:
22 List of Sessions • Liste des s
- Page 22 and 23:
24 Dimanche 28 mai • Sunday, May
- Page 24 and 25:
26 Lundi 29 mai • Monday, May 29,
- Page 26 and 27:
28 Lundi 29 mai • Monday, May 29,
- Page 28 and 29:
30 Lundi 29 mai • Monday, May 29,
- Page 30 and 31:
32 Lundi 29 mai • Monday, May 29,
- Page 32 and 33:
34 Lundi 29 mai • Monday, May 29,
- Page 35 and 36:
Mardi 30 mai • Tuesday, May 30, 1
- Page 37 and 38:
Mardi 30 mai • Tuesday, May 30, 1
- Page 39 and 40:
Mardi 30 mai • Tuesday, May 30, 1
- Page 41 and 42:
Mardi 30 mai • Tuesday, May 30, 1
- Page 43 and 44:
Mardi 30 mai • Tuesday, May 30, 1
- Page 45 and 46:
Mardi 30 mai • Tuesday, May 30, 1
- Page 47 and 48:
Mardi 30 mai • Tuesday, May 30, 1
- Page 49 and 50:
Mercredi 31 mai • Wednesday, May
- Page 51 and 52:
Mercredi 31 mai • Wednesday, May
- Page 53 and 54:
Mercredi 31 mai • Wednesday, May
- Page 55 and 56:
Mercredi 31 mai • Wednesday, May
- Page 57 and 58:
Mercredi 31 mai • Wednesday, May
- Page 59 and 60: 61Abstracts • RésumésSession 0
- Page 61 and 62: Dimanche 28 mai • Sunday, May 28,
- Page 63 and 64: Lundi 29 mai • Monday, May 29, 08
- Page 65 and 66: Lundi 29 mai • Monday, May 29, 10
- Page 67 and 68: Lundi 29 mai • Monday, May 29, 10
- Page 69 and 70: Lundi 29 mai • Monday, May 29, 10
- Page 71 and 72: Lundi 29 mai • Monday, May 29, 10
- Page 73 and 74: Lundi 29 mai • Monday, May 29, 10
- Page 75 and 76: Lundi 29 mai • Monday, May 29, 10
- Page 77 and 78: Lundi 29 mai • Monday, May 29, 10
- Page 79 and 80: Lundi 29 mai • Monday, May 29, 10
- Page 81 and 82: Lundi 29 mai • Monday, May 29, 13
- Page 83 and 84: Lundi 29 mai • Monday, May 29, 13
- Page 85 and 86: Lundi 29 mai • Monday, May 29, 15
- Page 87 and 88: Lundi 29 mai • Monday, May 29, 15
- Page 89 and 90: Lundi 29 mai • Monday, May 29, 15
- Page 91 and 92: Lundi 29 mai • Monday, May 29, 15
- Page 93 and 94: Lundi 29 mai • Monday, May 29, 15
- Page 95 and 96: Lundi 29 mai • Monday, May 29, 15
- Page 97 and 98: Lundi 29 mai • Monday, May 29, 15
- Page 99 and 100: Mardi 30 mai • Tuesday, May 30, 0
- Page 101 and 102: Mardi 30 mai • Tuesday, May 30, 1
- Page 103 and 104: Mardi 30 mai • Tuesday, May 30, 1
- Page 105 and 106: Mardi 30 mai • Tuesday, May 30, 1
- Page 107 and 108: Mardi 30 mai • Tuesday, May 30, 1
- Page 109: Mardi 30 mai • Tuesday, May 30, 1
- Page 113 and 114: Mardi 30 mai • Tuesday, May 30, 1
- Page 115 and 116: Mardi 30 mai • Tuesday, May 30, 1
- Page 117 and 118: Mardi 30 mai • Tuesday, May 30, 1
- Page 119 and 120: Mardi 30 mai • Tuesday, May 30, 1
- Page 121 and 122: Mardi 30 mai • Tuesday, May 30, 1
- Page 123 and 124: Mardi 30 mai • Tuesday, May 30, 1
- Page 125 and 126: Mardi 30 mai • Tuesday, May 30, 1
- Page 127 and 128: Mardi 30 mai • Tuesday, May 30, 1
- Page 129 and 130: Mardi 30 mai • Tuesday, May 30, 1
- Page 131 and 132: Mardi 30 mai • Tuesday, May 30, 1
- Page 133 and 134: Mardi 30 mai • Tuesday, May 30, 1
- Page 135 and 136: Mardi 30 mai • Tuesday, May 30, 1
- Page 137 and 138: Mardi 30 mai • Tuesday, May 30, 1
- Page 139 and 140: Mardi 30 mai • Tuesday, May 30, 1
- Page 141 and 142: Mardi 30 mai • Tuesday, May 30, 1
- Page 143 and 144: Mercredi 31 mai • Wednesday, May
- Page 145 and 146: Mercredi 31 mai • Wednesday, May
- Page 147 and 148: Mercredi 31 mai • Wednesday, May
- Page 149 and 150: Mercredi 31 mai • Wednesday, May
- Page 151 and 152: Mercredi 31 mai • Wednesday, May
- Page 153 and 154: Mercredi 31 mai • Wednesday, May
- Page 155 and 156: Mercredi 31 mai • Wednesday, May
- Page 157 and 158: Mercredi 31 mai • Wednesday, May
- Page 159 and 160: Mercredi 31 mai • Wednesday, May
- Page 161 and 162:
Mercredi 31 mai • Wednesday, May
- Page 163 and 164:
Mercredi 31 mai • Wednesday, May
- Page 165 and 166:
Mercredi 31 mai • Wednesday, May
- Page 167 and 168:
Mercredi 31 mai • Wednesday, May
- Page 169 and 170:
Mercredi 31 mai • Wednesday, May
- Page 171 and 172:
Mercredi 31 mai • Wednesday, May
- Page 173 and 174:
Mercredi 31 mai • Wednesday, May
- Page 175 and 176:
Mercredi 31 mai • Wednesday, May
- Page 177 and 178:
179Author Index • Index des auteu
- Page 179 and 180:
Author Index • Index des auteurs
- Page 181 and 182:
Author Index • Index des auteurs
- Page 183 and 184:
Author Index (per session) • Inde
- Page 185 and 186:
Author Index (per session) • Inde
- Page 187:
Author Index (per session) • Inde


