64 Dimanche 28 mai • Sunday, May 28, 19:00–21:00[MS-7]Generalizing Factor Analysis and Canonical Correlation to Three-way Arrays Increases their Ability toDisentangle InformationLa généralisation de l’analyse factorielle <strong>et</strong> de corrélation canonique aux tableaux à trois niveaux augmenteleur capacité de démêler l’informationRichard HARSHMAN, University of Western OntarioData analysis is often improved when stronger L’analyse de données est souvent améliorée lorsque les modèlesmodels are applied to stronger data. We discussles plus fiables sont appliqués aux données les plusone way of strengthening both: generaliz- fiables. Nous discutons une façon de renforcer tous lesing outer-pro<strong>du</strong>ct models from two-way (matrix) deux : la généralisation des modèles outer-pro<strong>du</strong>ct d’un<strong>et</strong>o three-way (array) form, and then applying them forme bidimensionnelle (matrice) à une forme tridimensiontodatas<strong>et</strong>s such as objects × variables × occasions, nelle (tableaux), <strong>et</strong> puis les appliquer aux jeux de donnéesor multiple covariance matrices. Often, the three- comme des obj<strong>et</strong>s × variables × occasions, ou des matricesway decomposition is ‘essentially unique’ without de covariance multiple. Souvent, la décomposition tridimenimposingorthogonality (or any other) constraints, sionnelle est « essentiellement unique » sans imposer leseliminating rotational ind<strong>et</strong>erminacies. Conse- contraintes d’orthogonalité (ou toute autre), élimination desquently, with appropriate data, one can recover, indéterminations de rotation. En conséquence, avec des donand/orrelate across two arrays, approximations of nées appropriées, on peut récupérer, <strong>et</strong>/ou associer à traversthe source patterns that originally generated the deux tableaux, approximations des modèles de source quicovariation, enabling new scientific applications ont à l’origine pro<strong>du</strong>it la covariation, perm<strong>et</strong>tant de nou-(e.g., see Google: parafac). Three-way PCA/factor velles applications scientifiques (par exemple, voir Google :analysis by PARAFAC and canonical analysis by parafac). L’analyse à trois niveaux de PCA/factor par PA-PARACCON (still under development) are dis- RAFAC <strong>et</strong> l’analyse canonique par PARACCON (toujourscussed.en cours de développement) sont discutées.[MS-8]Some Ideas About Forestry Data VisualizationQuelques idées au suj<strong>et</strong> de la visualisation de données reliées à la foresterieLutong ZHOU & Willard BRAUN, University of Western OntarioLe « grid package » (P. Murrell, 2005) est un outil pourvisualiser les données reliées à la foresterie. La fenêtred’affichage, un dispositif de grille, rend possible la com-paraison visuelle des groupes de graphiques disposés dansl’espace. Plusieurs fenêtres d’affichage peuvent être em-ployées pour construire les « caveplots » multiples (Becker<strong>et</strong> al, 1994) pour regarder la foudre <strong>et</strong> les données reliées àl’inflammation <strong>du</strong> feu à différents endroits. Ils peuvent éga-lement être employés pour modifier les nuages de pointsappariés pour explorer les rapports entre des variables deconditions d’alerte météorologiques <strong>et</strong> les indices de danger.L’édition des obj<strong>et</strong>s de grille (grobs) facilite les graphiquesd’animation dans R. Comme exemple, nous présentons legraphique (Plot) de Fengche pour la visualisation des donnéesreliées au vent.The grid package (P. Murrell, 2005) is a tool for visualizingforestry data. The viewport, a feature ofgrid, makes it possible to visually compare groupsof plots arranged spatially. Several viewports canbe used to construct multiple caveplots (Becker <strong>et</strong>al,1994) to view lightning and fire ignition data atdifferent locations. They can also be used to modifypairwise scatterplots for exploring relationshipsamong fire weather variables and danger ratings.The editing of grid objects (grobs) makes animatinggraphics in R easier. As an example, we intro<strong>du</strong>c<strong>et</strong>he Fengche plot for visualizing wind data.SH = Somerville House SSC = Social Science Centre UC = University College
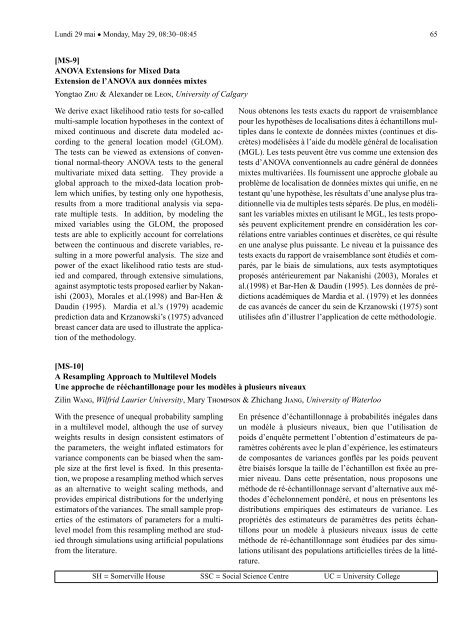
Lundi 29 mai • Monday, May 29, 08:30–08:45 65[MS-9]ANOVA Extensions for Mixed DataExtension de l’ANOVA aux données mixtesYongtao ZHU & Alexander DE LEON, University of CalgaryWe derive exact likelihood ratio tests for so-calledmulti-sample location hypotheses in the context ofNous obtenons les tests exacts <strong>du</strong> rapport de vraisemblancepour les hypothèses de localisations dites à échantillons mulmixedcontinuous and discr<strong>et</strong>e data modeled ac- tiples dans le contexte de données mixtes (continues <strong>et</strong> discordingto the general location model (GLOM). crètes) modélisées à l’aide <strong>du</strong> modèle général de localisationThe tests can be viewed as extensions of conven- (MGL). Les tests peuvent être vus comme une extension destional normal-theory ANOVA tests to the general tests d’ANOVA conventionnels au cadre général de donnéesmultivariate mixed data s<strong>et</strong>ting. They provide a mixtes multivariées. Ils fournissent une approche globale auglobal approach to the mixed-data location prob- problème de localisation de données mixtes qui unifie, en nelem which unifies, by testing only one hypothesis, testant qu’une hypothèse, les résultats d’une analyse plus traresultsfrom a more traditional analysis via sepa- ditionnelle via de multiples tests séparés. De plus, en modéliratemultiple tests. In addition, by modeling the sant les variables mixtes en utilisant le MGL, les tests propomixedvariables using the GLOM, the proposed sés peuvent explicitement prendre en considération les cortestsare able to explicitly account for correlations rélations entre variables continues <strong>et</strong> discrètes, ce qui résulteb<strong>et</strong>ween the continuous and discr<strong>et</strong>e variables, re- en une analyse plus puissante. Le niveau <strong>et</strong> la puissance dessulting in a more powerful analysis. The size and tests exacts <strong>du</strong> rapport de vraisemblance sont étudiés <strong>et</strong> compowerof the exact likelihood ratio tests are stud- parés, par le biais de simulations, aux tests asymptotiquesied and compared, through extensive simulations, proposés antérieurement par Nakanishi (2003), Morales <strong>et</strong>against asymptotic tests proposed earlier by Nakan- al.(1998) <strong>et</strong> Bar-Hen & Daudin (1995). Les données de préishi(2003), Morales <strong>et</strong> al.(1998) and Bar-Hen & dictions académiques de Mardia <strong>et</strong> al. (1979) <strong>et</strong> les donnéesDaudin (1995). Mardia <strong>et</strong> al.’s (1979) academic de cas avancés de cancer <strong>du</strong> sein de Krzanowski (1975) sontprediction data and Krzanowski’s (1975) advanced utilisées afin d’illustrer l’application de c<strong>et</strong>te méthodologie.breast cancer data are used to illustrate the applicationof the m<strong>et</strong>hodology.[MS-10]A Resampling Approach to Multilevel ModelsUne approche de rééchantillonage pour les modèles à plusieurs niveauxZilin WANG, Wilfrid Laurier University, Mary THOMPSON & Zhichang JIANG, University of WaterlooEn présence d’échantillonnage à probabilités inégales dansun modèle à plusieurs niveaux, bien que l’utilisation depoids d’enquête perm<strong>et</strong>tent l’obtention d’estimateurs de pa-ramètres cohérents avec le plan d’expérience, les estimateursde composantes de variances gonflés par les poids peuventêtre biaisés lorsque la taille de l’échantillon est fixée au pre-mier niveau. Dans c<strong>et</strong>te présentation, nous proposons uneméthode de ré-échantillonnage servant d’alternative aux mé-thodes d’échelonnement pondéré, <strong>et</strong> nous en présentons lesdistributions empiriques des estimateurs de variance. Lespropriétés des estimateurs de paramètres des p<strong>et</strong>its échan-tillons pour un modèle à plusieurs niveaux issus de c<strong>et</strong>teméthode de ré-échantillonnage sont étudiées par des simu-lations utilisant des populations artificielles tirées de la littérature.With the presence of unequal probability samplingin a multilevel model, although the use of surveyweights results in design consistent estimators ofthe param<strong>et</strong>ers, the weight inflated estimators forvariance components can be biased when the samplesize at the first level is fixed. In this presentation,we propose a resampling m<strong>et</strong>hod which servesas an alternative to weight scaling m<strong>et</strong>hods, andprovides empirical distributions for the underlyingestimators of the variances. The small sample propertiesof the estimators of param<strong>et</strong>ers for a multilevelmodel from this resampling m<strong>et</strong>hod are studiedthrough simulations using artificial populationsfrom the literature.SH = Somerville House SSC = Social Science Centre UC = University College
- Page 1 and 2:
3Table of Contents • Table des ma
- Page 3 and 4:
Welcome • Bienvenue 5détails sur
- Page 5 and 6:
7Organizers • OrganisateursLocal
- Page 7 and 8:
General Information • Information
- Page 9 and 10:
General Information • Information
- Page 12 and 13: 14 Committees and Meetings • Comi
- Page 14 and 15: 16 Committees and Meetings • Comi
- Page 16 and 17: 18 List of Sessions • Liste des s
- Page 18 and 19: 20 List of Sessions • Liste des s
- Page 20 and 21: 22 List of Sessions • Liste des s
- Page 22 and 23: 24 Dimanche 28 mai • Sunday, May
- Page 24 and 25: 26 Lundi 29 mai • Monday, May 29,
- Page 26 and 27: 28 Lundi 29 mai • Monday, May 29,
- Page 28 and 29: 30 Lundi 29 mai • Monday, May 29,
- Page 30 and 31: 32 Lundi 29 mai • Monday, May 29,
- Page 32 and 33: 34 Lundi 29 mai • Monday, May 29,
- Page 35 and 36: Mardi 30 mai • Tuesday, May 30, 1
- Page 37 and 38: Mardi 30 mai • Tuesday, May 30, 1
- Page 39 and 40: Mardi 30 mai • Tuesday, May 30, 1
- Page 41 and 42: Mardi 30 mai • Tuesday, May 30, 1
- Page 43 and 44: Mardi 30 mai • Tuesday, May 30, 1
- Page 45 and 46: Mardi 30 mai • Tuesday, May 30, 1
- Page 47 and 48: Mardi 30 mai • Tuesday, May 30, 1
- Page 49 and 50: Mercredi 31 mai • Wednesday, May
- Page 51 and 52: Mercredi 31 mai • Wednesday, May
- Page 53 and 54: Mercredi 31 mai • Wednesday, May
- Page 55 and 56: Mercredi 31 mai • Wednesday, May
- Page 57 and 58: Mercredi 31 mai • Wednesday, May
- Page 59 and 60: 61Abstracts • RésumésSession 0
- Page 61: Dimanche 28 mai • Sunday, May 28,
- Page 65 and 66: Lundi 29 mai • Monday, May 29, 10
- Page 67 and 68: Lundi 29 mai • Monday, May 29, 10
- Page 69 and 70: Lundi 29 mai • Monday, May 29, 10
- Page 71 and 72: Lundi 29 mai • Monday, May 29, 10
- Page 73 and 74: Lundi 29 mai • Monday, May 29, 10
- Page 75 and 76: Lundi 29 mai • Monday, May 29, 10
- Page 77 and 78: Lundi 29 mai • Monday, May 29, 10
- Page 79 and 80: Lundi 29 mai • Monday, May 29, 10
- Page 81 and 82: Lundi 29 mai • Monday, May 29, 13
- Page 83 and 84: Lundi 29 mai • Monday, May 29, 13
- Page 85 and 86: Lundi 29 mai • Monday, May 29, 15
- Page 87 and 88: Lundi 29 mai • Monday, May 29, 15
- Page 89 and 90: Lundi 29 mai • Monday, May 29, 15
- Page 91 and 92: Lundi 29 mai • Monday, May 29, 15
- Page 93 and 94: Lundi 29 mai • Monday, May 29, 15
- Page 95 and 96: Lundi 29 mai • Monday, May 29, 15
- Page 97 and 98: Lundi 29 mai • Monday, May 29, 15
- Page 99 and 100: Mardi 30 mai • Tuesday, May 30, 0
- Page 101 and 102: Mardi 30 mai • Tuesday, May 30, 1
- Page 103 and 104: Mardi 30 mai • Tuesday, May 30, 1
- Page 105 and 106: Mardi 30 mai • Tuesday, May 30, 1
- Page 107 and 108: Mardi 30 mai • Tuesday, May 30, 1
- Page 109 and 110: Mardi 30 mai • Tuesday, May 30, 1
- Page 111 and 112: Mardi 30 mai • Tuesday, May 30, 1
- Page 113 and 114:
Mardi 30 mai • Tuesday, May 30, 1
- Page 115 and 116:
Mardi 30 mai • Tuesday, May 30, 1
- Page 117 and 118:
Mardi 30 mai • Tuesday, May 30, 1
- Page 119 and 120:
Mardi 30 mai • Tuesday, May 30, 1
- Page 121 and 122:
Mardi 30 mai • Tuesday, May 30, 1
- Page 123 and 124:
Mardi 30 mai • Tuesday, May 30, 1
- Page 125 and 126:
Mardi 30 mai • Tuesday, May 30, 1
- Page 127 and 128:
Mardi 30 mai • Tuesday, May 30, 1
- Page 129 and 130:
Mardi 30 mai • Tuesday, May 30, 1
- Page 131 and 132:
Mardi 30 mai • Tuesday, May 30, 1
- Page 133 and 134:
Mardi 30 mai • Tuesday, May 30, 1
- Page 135 and 136:
Mardi 30 mai • Tuesday, May 30, 1
- Page 137 and 138:
Mardi 30 mai • Tuesday, May 30, 1
- Page 139 and 140:
Mardi 30 mai • Tuesday, May 30, 1
- Page 141 and 142:
Mardi 30 mai • Tuesday, May 30, 1
- Page 143 and 144:
Mercredi 31 mai • Wednesday, May
- Page 145 and 146:
Mercredi 31 mai • Wednesday, May
- Page 147 and 148:
Mercredi 31 mai • Wednesday, May
- Page 149 and 150:
Mercredi 31 mai • Wednesday, May
- Page 151 and 152:
Mercredi 31 mai • Wednesday, May
- Page 153 and 154:
Mercredi 31 mai • Wednesday, May
- Page 155 and 156:
Mercredi 31 mai • Wednesday, May
- Page 157 and 158:
Mercredi 31 mai • Wednesday, May
- Page 159 and 160:
Mercredi 31 mai • Wednesday, May
- Page 161 and 162:
Mercredi 31 mai • Wednesday, May
- Page 163 and 164:
Mercredi 31 mai • Wednesday, May
- Page 165 and 166:
Mercredi 31 mai • Wednesday, May
- Page 167 and 168:
Mercredi 31 mai • Wednesday, May
- Page 169 and 170:
Mercredi 31 mai • Wednesday, May
- Page 171 and 172:
Mercredi 31 mai • Wednesday, May
- Page 173 and 174:
Mercredi 31 mai • Wednesday, May
- Page 175 and 176:
Mercredi 31 mai • Wednesday, May
- Page 177 and 178:
179Author Index • Index des auteu
- Page 179 and 180:
Author Index • Index des auteurs
- Page 181 and 182:
Author Index • Index des auteurs
- Page 183 and 184:
Author Index (per session) • Inde
- Page 185 and 186:
Author Index (per session) • Inde
- Page 187:
Author Index (per session) • Inde