Programme et résumés (pdf) - Société statistique du Canada
Programme et résumés (pdf) - Société statistique du Canada
Programme et résumés (pdf) - Société statistique du Canada
Create successful ePaper yourself
Turn your PDF publications into a flip-book with our unique Google optimized e-Paper software.
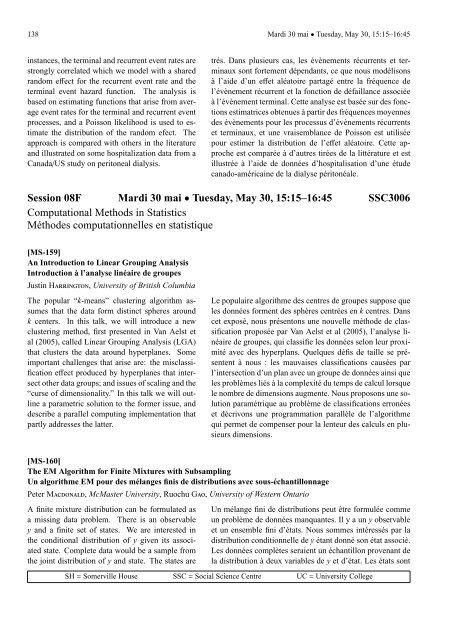
138 Mardi 30 mai • Tuesday, May 30, 15:15–16:45instances, the terminal and recurrent event rates are trés. Dans plusieurs cas, les évènements récurrents <strong>et</strong> terstronglycorrelated which we model with a shared minaux sont fortement dépendants, ce que nous modélisonsrandom effect for the recurrent event rate and the à l’aide d’un eff<strong>et</strong> aléatoire partagé entre la fréquence d<strong>et</strong>erminal event hazard function. The analysis is l’évènement récurrent <strong>et</strong> la fonction de défaillance associéebased on estimating functions that arise from aver- à l’évènement terminal. C<strong>et</strong>te analyse est basée sur des foncageevent rates for the terminal and recurrent event tions estimatrices obtenues à partir des fréquences moyennesprocesses, and a Poisson likelihood is used to es- des évènements pour les processus d’évènements récurrentstimate the distribution of the random efect. The <strong>et</strong> terminaux, <strong>et</strong> une vraisemblance de Poisson est utiliséeapproach is compared with others in the literature pour estimer la distribution de l’eff<strong>et</strong> aléatoire. C<strong>et</strong>te apandillustrated on some hospitalization data from a proche est comparée à d’autres tirées de la littérature <strong>et</strong> est<strong>Canada</strong>/US study on peritoneal dialysis.illustrée à l’aide de données d’hospitalisation d’une étudecanado-américaine de la dialyse péritonéale.Session 08F Mardi 30 mai • Tuesday, May 30, 15:15–16:45 SSC3006Computational M<strong>et</strong>hods in StatisticsMéthodes computationnelles en <strong>statistique</strong>[MS-159]An Intro<strong>du</strong>ction to Linear Grouping AnalysisIntro<strong>du</strong>ction à l’analyse linéaire de groupesJustin HARRINGTON, University of British ColumbiaThe popular “k-means” clustering algorithm assumesthat the data form distinct spheres aroundLe populaire algorithme des centres de groupes suppose queles données forment des sphères centrées en k centres. Dansk centers. In this talk, we will intro<strong>du</strong>ce a new c<strong>et</strong> exposé, nous présentons une nouvelle méthode de clasclusteringm<strong>et</strong>hod, first presented in Van Aelst <strong>et</strong> sification proposée par Van Aelst <strong>et</strong> al (2005), l’analyse lial(2005), called Linear Grouping Analysis (LGA) néaire de groupes, qui classifie les données selon leur proxithatclusters the data around hyperplanes. Some mité avec des hyperplans. Quelques défis de taille se préimportantchallenges that arise are: the misclassi- sentent à nous : les mauvaises classifications causées parfication effect pro<strong>du</strong>ced by hyperplanes that inter- l’intersection d’un plan avec un groupe de données ainsi quesect other data groups; and issues of scaling and the les problèmes liés à la complexité <strong>du</strong> temps de calcul lorsque“curse of dimensionality.” In this talk we will out- le nombre de dimensions augmente. Nous proposons une solinea param<strong>et</strong>ric solution to the former issue, and lution paramétrique au problème de classifications erronéesdescribe a parallel computing implementation that <strong>et</strong> décrivons une programmation parallèle de l’algorithmepartly addresses the latter.qui perm<strong>et</strong> de compenser pour la lenteur des calculs en plusieursdimensions.[MS-160]The EM Algorithm for Finite Mixtures with SubsamplingUn algorithme EM pour des mélanges finis de distributions avec sous-échantillonnageP<strong>et</strong>er MACDONALD, McMaster University, Ruochu GAO, University of Western OntarioA finite mixture distribution can be formulated as Un mélange fini de distributions peut être formulée commea missing data problem. There is an observable un problème de données manquantes. Il y a un y observabley and a finite s<strong>et</strong> of states. We are interested in <strong>et</strong> un ensemble fini d’états. Nous sommes intéressés par lathe conditional distribution of y given its associ- distribution conditionnelle de y étant donné son état associé.ated state. Compl<strong>et</strong>e data would be a sample from Les données complètes seraient un échantillon provenant d<strong>et</strong>he joint distribution of y and state. The states are la distribution à deux variables de y <strong>et</strong> d’état. Les états sontSH = Somerville House SSC = Social Science Centre UC = University College


