Programme et résumés (pdf) - Société statistique du Canada
Programme et résumés (pdf) - Société statistique du Canada
Programme et résumés (pdf) - Société statistique du Canada

You also want an ePaper? Increase the reach of your titles
YUMPU automatically turns print PDFs into web optimized ePapers that Google loves.
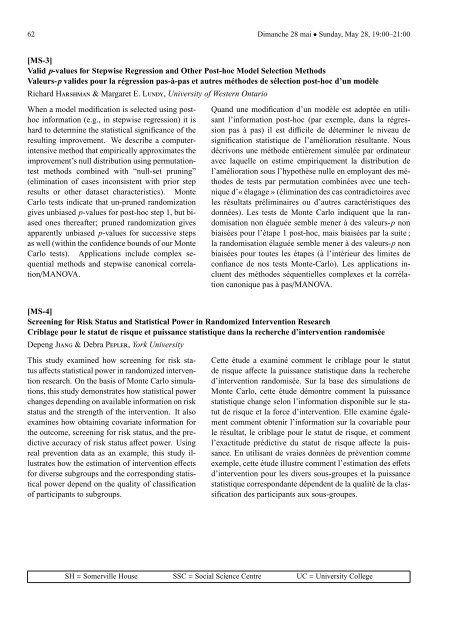
62 Dimanche 28 mai • Sunday, May 28, 19:00–21:00[MS-3]Valid p-values for Stepwise Regression and Other Post-hoc Model Selection M<strong>et</strong>hodsValeurs-p valides pour la régression pas-à-pas <strong>et</strong> autres méthodes de sélection post-hoc d’un modèleRichard HARSHMAN & Margar<strong>et</strong> E. LUNDY, University of Western OntarioWhen a model modification is selected using posthocinformation (e.g., in stepwise regression) it isQuand une modification d’un modèle est adoptée en utilisantl’information post-hoc (par exemple, dans la régreshardto d<strong>et</strong>ermine the statistical significance of the sion pas à pas) il est difficile de déterminer le niveau deresulting improvement. We describe a computer- signification <strong>statistique</strong> de l’amélioration résultante. Nousintensive m<strong>et</strong>hod that empirically approximates the décrivons une méthode entièrement simulée par ordinateurimprovement’s null distribution using permutation- avec laquelle on estime empiriquement la distribution d<strong>et</strong>est m<strong>et</strong>hods combined with “null-s<strong>et</strong> pruning” l’amélioration sous l’hypothèse nulle en employant des mé-(elimination of cases inconsistent with prior step thodes de tests par permutation combinées avec une techresultsor other datas<strong>et</strong> characteristics). Monte nique d’« élagage » (élimination des cas contradictoires avecCarlo tests indicate that un-pruned randomization les résultats préliminaires ou d’autres caractéristiques desgives unbiased p-values for post-hoc step 1, but bi- données). Les tests de Monte Carlo indiquent que la ranasedones thereafter; pruned randomization gives domisation non élaguée semble mener à des valeurs-p nonapparently unbiased p-values for successive steps biaisées pour l’étape 1 post-hoc, mais biaisées par la suite ;as well (within the confidence bounds of our Monte la randomisation élaguée semble mener à des valeurs-p nonCarlo tests). Applications include complex se- biaisées pour toutes les étapes (à l’intérieur des limites dequential m<strong>et</strong>hods and stepwise canonical correla- confiance de nos tests Monte-Carlo). Les applications intion/MANOVA.cluent des méthodes séquentielles complexes <strong>et</strong> la corrélationcanonique pas à pas/MANOVA.[MS-4]Screening for Risk Status and Statistical Power in Randomized Intervention ResearchCriblage pour le statut de risque <strong>et</strong> puissance <strong>statistique</strong> dans la recherche d’intervention randomiséeDepeng JIANG & Debra PEPLER, York UniversityThis study examined how screening for risk statusaffects statistical power in randomized interventionresearch. On the basis of Monte Carlo simulations,this study demonstrates how statistical powerchanges depending on available information on riskstatus and the strength of the intervention. It alsoexamines how obtaining covariate information forthe outcome, screening for risk status, and the predictiveaccuracy of risk status affect power. Usingreal prevention data as an example, this study illustrateshow the estimation of intervention effectsfor diverse subgroups and the corresponding statisticalpower depend on the quality of classificationof participants to subgroups.C<strong>et</strong>te étude a examiné comment le criblage pour le statutde risque affecte la puissance <strong>statistique</strong> dans la recherched’intervention randomisée. Sur la base des simulations deMonte Carlo, c<strong>et</strong>te étude démontre comment la puissance<strong>statistique</strong> change selon l’information disponible sur le sta-tut de risque <strong>et</strong> la force d’intervention. Elle examine égale-ment comment obtenir l’information sur la covariable pourle résultat, le criblage pour le statut de risque, <strong>et</strong> commentl’exactitude prédictive <strong>du</strong> statut de risque affecte la puis-sance. En utilisant de vraies données de prévention commeexemple, c<strong>et</strong>te étude illustre comment l’estimation des eff<strong>et</strong>sd’intervention pour les divers sous-groupes <strong>et</strong> la puissance<strong>statistique</strong> correspondante dépendent de la qualité de la clas-sification des participants aux sous-groupes.SH = Somerville House SSC = Social Science Centre UC = University College