- Page 1:
AGENCE REGIONALE DE SANTE RHONE-ALP
- Page 7 and 8:
SommaireVOLET AMBULATOIRE DE L’OF
- Page 9:
VOLET AMBULATOIREDE L’OFFRE DE SO
- Page 13 and 14:
Diagnostic et enjeuxUn diagnostic a
- Page 15 and 16:
Diagnostic et enjeuxVOLET AMBULATOI
- Page 17 and 18:
Diagnostic et enjeuxVOLET AMBULATOI
- Page 19 and 20:
Diagnostic et enjeuxVOLET AMBULATOI
- Page 21 and 22:
Diagnostic et enjeuxVOLET AMBULATOI
- Page 23 and 24:
Diagnostic et enjeuxVOLET AMBULATOI
- Page 25 and 26:
Diagnostic et enjeuxVOLET AMBULATOI
- Page 27 and 28:
Diagnostic et enjeuxVOLET AMBULATOI
- Page 29 and 30:
Diagnostic et enjeuxVOLET AMBULATOI
- Page 31 and 32:
Diagnostic et enjeuxVOLET AMBULATOI
- Page 33 and 34:
Diagnostic et enjeuxVOLET AMBULATOI
- Page 35 and 36:
Diagnostic et enjeuxVOLET AMBULATOI
- Page 37 and 38:
Diagnostic et enjeuxVOLET AMBULATOI
- Page 39 and 40:
Diagnostic et enjeuxVOLET AMBULATOI
- Page 41: Diagnostic et enjeuxVOLET AMBULATOI
- Page 44 and 45: Mode opératoireVOLET AMBULATOIRE D
- Page 46 and 47: Mode opératoireVOLET AMBULATOIRE D
- Page 48 and 49: Mode opératoireVOLET AMBULATOIRE D
- Page 50 and 51: Mode opératoireVOLET AMBULATOIRE D
- Page 52 and 53: Mode opératoireVOLET AMBULATOIRE D
- Page 54 and 55: Mode opératoireVOLET AMBULATOIRE D
- Page 56 and 57: Mode opératoireVOLET AMBULATOIRE D
- Page 58 and 59: Mode opératoireVOLET AMBULATOIRE D
- Page 60 and 61: Plan d’actionsVOLET AMBULATOIRE D
- Page 62 and 63: Plan d’actionsVOLET AMBULATOIRE D
- Page 64 and 65: Plan d’actionsVOLET AMBULATOIRE D
- Page 66 and 67: Plan d’actionsVOLET AMBULATOIRE D
- Page 68 and 69: Plan d’actionsVOLET AMBULATOIRE D
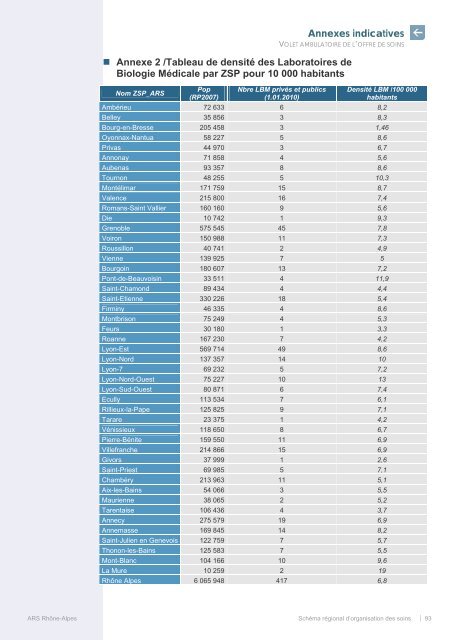
- Page 70 and 71: Annexes indicativesVOLET AMBULATOIR
- Page 72 and 73: Annexes indicativesVOLET AMBULATOIR
- Page 74 and 75: Annexes indicativesVOLET AMBULATOIR
- Page 76 and 77: Annexes indicativesVOLET AMBULATOIR
- Page 78 and 79: Annexes indicativesVOLET AMBULATOIR
- Page 80 and 81: Annexes indicativesVOLET AMBULATOIR
- Page 82 and 83: Annexes indicativesVOLET AMBULATOIR
- Page 84 and 85: Annexes indicativesVOLET AMBULATOIR
- Page 86 and 87: Annexes indicativesVOLET AMBULATOIR
- Page 88 and 89: Annexes indicativesVOLET AMBULATOIR
- Page 90 and 91: Annexes indicativesVOLET AMBULATOIR
- Page 94 and 95: Annexes indicativesVOLET AMBULATOIR
- Page 96 and 97: Annexes opposablesVOLET AMBULATOIRE
- Page 98 and 99: Annexes opposablesVOLET AMBULATOIRE
- Page 100 and 101: Annexes opposablesVOLET AMBULATOIRE
- Page 102 and 103: Annexes opposablesVOLET AMBULATOIRE
- Page 104 and 105: Annexes opposablesVOLET AMBULATOIRE
- Page 106 and 107: Annexes opposablesVOLET AMBULATOIRE
- Page 108 and 109: Annexes opposablesVOLET AMBULATOIRE
- Page 110 and 111: Annexes opposablesVOLET AMBULATOIRE
- Page 112 and 113: Annexes opposablesVOLET AMBULATOIRE
- Page 114 and 115: Annexes opposablesVOLET AMBULATOIRE
- Page 116 and 117: • Table des zonages de la région
- Page 118 and 119: Annexes opposablesVOLET AMBULATOIRE
- Page 120 and 121: Annexes opposablesVOLET AMBULATOIRE
- Page 122 and 123: Annexes opposablesVOLET AMBULATOIRE
- Page 124 and 125: Annexes opposablesVOLET AMBULATOIRE
- Page 126 and 127: Annexes opposablesVOLET AMBULATOIRE
- Page 128 and 129: Annexes opposablesVOLET AMBULATOIRE
- Page 130 and 131: Annexes opposablesVOLET AMBULATOIRE
- Page 132 and 133: Annexes opposablesVOLET AMBULATOIRE
- Page 134 and 135: Annexes opposablesVOLET AMBULATOIRE
- Page 136 and 137: Annexes opposablesVOLET AMBULATOIRE
- Page 138 and 139: Annexes opposablesVOLET AMBULATOIRE
- Page 140 and 141: Annexes opposablesVOLET AMBULATOIRE
- Page 142 and 143:
Annexes opposablesVOLET AMBULATOIRE
- Page 144 and 145:
Annexes opposablesVOLET AMBULATOIRE
- Page 146 and 147:
Annexes opposablesVOLET AMBULATOIRE
- Page 148 and 149:
Annexes opposablesVOLET AMBULATOIRE
- Page 150 and 151:
Annexes opposablesVOLET AMBULATOIRE
- Page 152 and 153:
Annexes opposablesVOLET AMBULATOIRE
- Page 154 and 155:
Annexes opposablesVOLET AMBULATOIRE
- Page 156 and 157:
Annexes opposablesVOLET AMBULATOIRE
- Page 158 and 159:
Annexes opposablesVOLET AMBULATOIRE
- Page 160 and 161:
Annexes opposablesVOLET AMBULATOIRE
- Page 162 and 163:
Annexes opposablesVOLET AMBULATOIRE
- Page 164 and 165:
Annexes opposablesVOLET AMBULATOIRE
- Page 166 and 167:
Annexes opposablesVOLET AMBULATOIRE
- Page 168 and 169:
Annexes opposablesVOLET AMBULATOIRE
- Page 170 and 171:
Annexes opposablesVOLET AMBULATOIRE
- Page 172 and 173:
Annexes opposablesVOLET AMBULATOIRE
- Page 174 and 175:
Annexes opposablesVOLET AMBULATOIRE
- Page 176 and 177:
Annexes opposablesVOLET AMBULATOIRE
- Page 178 and 179:
Annexes opposablesVOLET AMBULATOIRE
- Page 180 and 181:
Annexes opposablesVOLET AMBULATOIRE
- Page 182 and 183:
Annexes opposablesVOLET AMBULATOIRE
- Page 184 and 185:
Annexes opposablesVOLET AMBULATOIRE
- Page 186 and 187:
Annexes opposablesVOLET AMBULATOIRE
- Page 188 and 189:
Annexes opposablesVOLET AMBULATOIRE
- Page 190 and 191:
Annexes opposablesVOLET AMBULATOIRE
- Page 192 and 193:
Annexes opposablesVOLET AMBULATOIRE
- Page 194 and 195:
Annexes opposablesVOLET AMBULATOIRE
- Page 196 and 197:
Annexes opposablesVOLET AMBULATOIRE
- Page 198 and 199:
Annexes opposablesVOLET AMBULATOIRE
- Page 200 and 201:
Annexes opposablesVOLET AMBULATOIRE
- Page 202 and 203:
Annexes opposablesVOLET AMBULATOIRE
- Page 205:
DECLINAISON DES PRIORITES DU PLANST
- Page 209 and 210:
Axe 1Le développement de la préve
- Page 211 and 212:
Axe 1Le développement de la préve
- Page 213 and 214:
Axe 1Le développement de la préve
- Page 215 and 216:
Axe 1Le développement de la préve
- Page 217 and 218:
Axe 1Le développement de la préve
- Page 219 and 220:
Axe 1Le développement de la préve
- Page 221 and 222:
Axe 1Le développement de la préve
- Page 223 and 224:
Axe 1Le développement de la préve
- Page 225 and 226:
Axe 1Le développement de la préve
- Page 227 and 228:
Axe 1Le développement de la préve
- Page 229 and 230:
Axe 1Le développement de la préve
- Page 231 and 232:
Axe 1Le développement de la préve
- Page 233:
Axe 1Le développement de la préve
- Page 236 and 237:
Axe 2L’accès à une offre en san
- Page 238 and 239:
[ ORIENTATION 2 ]AMELIORER L’ESPE
- Page 240 and 241:
Axe 2L’accès à une offre en san
- Page 242 and 243:
Axe 2L’accès à une offre en san
- Page 244 and 245:
Axe 2L’accès à une offre en san
- Page 246 and 247:
Axe 2L’accès à une offre en san
- Page 248 and 249:
Axe 2L’accès à une offre en san
- Page 250 and 251:
Axe 2L’accès à une offre en san
- Page 252 and 253:
Axe 2L’accès à une offre en san
- Page 254 and 255:
Axe 2L’accès à une offre en san
- Page 256 and 257:
Axe 2L’accès à une offre en san
- Page 258 and 259:
Axe 2L’accès à une offre en san
- Page 260 and 261:
Axe 2L’accès à une offre en san
- Page 262 and 263:
Axe 2L’accès à une offre en san
- Page 264 and 265:
Axe 2L’accès à une offre en san
- Page 266 and 267:
Axe 3La fluidité des prises en cha
- Page 268 and 269:
Axe 3La fluidité des prises en cha
- Page 270 and 271:
Axe 3La fluidité des prises en cha
- Page 272 and 273:
Axe 3La fluidité des prises en cha
- Page 274 and 275:
Axe 3La fluidité des prises en cha
- Page 276 and 277:
Axe 3La fluidité des prises en cha
- Page 278 and 279:
Axe 3La fluidité des prises en cha
- Page 280 and 281:
Axe 3La fluidité des prises en cha
- Page 282 and 283:
Axe 3La fluidité des prises en cha
- Page 284 and 285:
Axe 3La fluidité des prises en cha
- Page 286 and 287:
Axe 3La fluidité des prises en cha
- Page 288 and 289:
Axe 3La fluidité des prises en cha
- Page 290 and 291:
Axe 3La fluidité des prises en cha
- Page 292 and 293:
Axe 3La fluidité des prises en cha
- Page 294 and 295:
Axe 3La fluidité des prises en cha
- Page 296 and 297:
Axe 3La fluidité des prises en cha
- Page 298 and 299:
Axe 3La fluidité des prises en cha
- Page 301 and 302:
Les volets thématiques[VOLET MEDEC
- Page 303 and 304:
Les volets thématiquesVOLET DE L
- Page 305 and 306:
Les volets thématiquesVOLET DE L
- Page 307 and 308:
Les volets thématiquesVOLET DE L
- Page 309 and 310:
Les volets thématiquesVOLET DE L
- Page 311 and 312:
Les volets thématiquesVOLET DE L
- Page 313 and 314:
Les volets thématiquesVOLET DE L
- Page 315 and 316:
Les volets thématiquesVOLET DE L
- Page 317 and 318:
Les volets thématiquesVOLET DE L
- Page 319 and 320:
Les volets thématiquesVOLET DE L
- Page 321 and 322:
Les volets thématiquesVOLET DE L
- Page 323 and 324:
Les volets thématiquesVOLET DE L
- Page 325 and 326:
Les volets thématiquesVOLET DE L
- Page 327 and 328:
Les volets thématiquesVOLET DE L
- Page 329 and 330:
Les volets thématiquesVOLET DE L
- Page 331 and 332:
En termes d’accessibilité aux so
- Page 333 and 334:
Les volets thématiquesVOLET DE L
- Page 335 and 336:
Les volets thématiquesVOLET DE L
- Page 337 and 338:
Les volets thématiquesVOLET DE L
- Page 339 and 340:
Les volets thématiquesVOLET DE L
- Page 341 and 342:
Les volets thématiquesVOLET DE L
- Page 343 and 344:
Les volets thématiquesVOLET DE L
- Page 345 and 346:
Les volets thématiquesVOLET DE L
- Page 347 and 348:
Les volets thématiquesVOLET DE L
- Page 349 and 350:
Les volets thématiquesVOLET DE L
- Page 351 and 352:
Les volets thématiquesVOLET DE L
- Page 353 and 354:
Les volets thématiquesVOLET DE L
- Page 355 and 356:
Les volets thématiquesVOLET DE L
- Page 357 and 358:
Les volets thématiquesVOLET DE L
- Page 359 and 360:
Les volets thématiquesVOLET DE L
- Page 361 and 362:
Les volets thématiquesVOLET DE L
- Page 363 and 364:
Les volets thématiquesVOLET DE L
- Page 365 and 366:
Les volets thématiquesVOLET DE L
- Page 367 and 368:
Les volets thématiquesVOLET DE L
- Page 369 and 370:
Les volets thématiquesVOLET DE L
- Page 371 and 372:
Les volets thématiquesVOLET DE L
- Page 373 and 374:
Les volets thématiquesVOLET DE L
- Page 375 and 376:
Les volets thématiquesVOLET DE L
- Page 377 and 378:
Les volets thématiquesVOLET DE L
- Page 379 and 380:
Les volets thématiquesVOLET DE L
- Page 381 and 382:
Les volets thématiquesVOLET DE L
- Page 383 and 384:
Les volets thématiquesVOLET DE L
- Page 385 and 386:
Les volets thématiquesVOLET DE L
- Page 387 and 388:
Les volets thématiquesVOLET DE L
- Page 389 and 390:
Les volets thématiquesVOLET DE L
- Page 391 and 392:
Les volets thématiquesVOLET DE L
- Page 393 and 394:
Les volets thématiquesVOLET DE L
- Page 395:
Les volets thématiquesVOLET DE L
- Page 398 and 399:
Les annexes territoriales opposable
- Page 400 and 401:
Les annexes territoriales opposable
- Page 402 and 403:
Les annexes territoriales opposable
- Page 404 and 405:
Les annexes territoriales opposable
- Page 406 and 407:
Les annexes territoriales opposable
- Page 408 and 409:
Les annexes territoriales opposable
- Page 410 and 411:
Les annexes territoriales opposable
- Page 412 and 413:
Les annexes territoriales opposable
- Page 414 and 415:
Les annexes territoriales opposable
- Page 416 and 417:
Les annexes territoriales opposable
- Page 418 and 419:
Les annexes territoriales opposable
- Page 420 and 421:
Les annexes territoriales opposable
- Page 422 and 423:
Les annexes territoriales opposable
- Page 424 and 425:
Les annexes territoriales opposable
- Page 426 and 427:
Activités de soins de premiers rec
- Page 428 and 429:
Les annexes territoriales opposable
- Page 430 and 431:
Les annexes territoriales opposable
- Page 432 and 433:
Les annexes territoriales opposable
- Page 434 and 435:
• Le territoire de Santé EST TS0
- Page 436 and 437:
Les annexes territoriales opposable
- Page 438 and 439:
Les annexes territoriales opposable
- Page 440 and 441:
Les annexes territoriales opposable
- Page 442 and 443:
Les annexes territoriales opposable
- Page 444 and 445:
Les annexes territoriales opposable
- Page 446 and 447:
Les annexes territoriales opposable
- Page 448 and 449:
Les annexes territoriales opposable
- Page 450 and 451:
Les annexes territoriales opposable
- Page 452 and 453:
Les annexes territoriales opposable
- Page 454 and 455:
Les annexes territoriales opposable
- Page 456 and 457:
Les annexes territoriales opposable
- Page 458 and 459:
• Le territoire de sante Sud TS05
- Page 460 and 461:
Les annexes territoriales opposable
- Page 462 and 463:
Les annexes territoriales opposable
- Page 464 and 465:
Les annexes territoriales opposable
- Page 466 and 467:
Les annexes territoriales opposable
- Page 468 and 469:
468/5Les communes du département d
- Page 470 and 471:
Les territoires de santé enRhône-
- Page 472 and 473:
Les territoires de santé enRhône-
- Page 474 and 475:
Les territoires de santé enRhône-
- Page 476 and 477:
Les territoires de santé enRhône-
- Page 478 and 479:
Les territoires de santé enRhône-
- Page 480 and 481:
Les territoires de santé enRhône-
- Page 482 and 483:
Les territoires de santé enRhône-
- Page 484 and 485:
Les territoires de santé enRhône-
- Page 486 and 487:
Les territoires de santé enRhône-
- Page 488 and 489:
Les territoires de santé enRhône-
- Page 490 and 491:
Les territoires de santé enRhône-
- Page 493:
ELEMENTS RELATIFS AU CHIFFRAGEPREVI
- Page 496 and 497:
Chiffrage prévisionnel du SROS PRS
- Page 498:
Chiffrage prévisionnel du SROS PRS
- Page 504:
Agence régionale de santé Rhône-