190 QUADRO 4.20 – COMPARATIVO DA EFICIÊNCIA DAS TECNOLOGIAS DE TRATAMENTO AVANÇADO EM RELAÇÃO AO CRITÉRIO DE REÚSO PARA ÁGUA DE PROCESSO Parâmetros e seus requisitos <strong>para</strong> reúso Tecnologia Resultado do tratamento DBO (mg/L) DQO (mg/L) Cor (Hazen) CT (mg/L) COT (mg/L) CI (mg/L) ST (mg/L) SST (mg/L) SDT (mg/L) Turbi<strong>de</strong>z (NTU) pH CT M (NMP/ 100ml) CF (NMP/ 100ml) Condutivida<strong>de</strong> (μ.S/cm) ≤ 30 ≤ 50 ≤ 20 SE SE SE ≤ 1005 ≤ 5 ≤ 1000 ≤ 2 6 - 8 ≤ 2,2 Ausente SE Carvão Ativado (1) R<strong>em</strong>oção 4,78 < 2,5 9,38 2,51 6,87 0,71 9,43 < 1 < 1 Eficiência 96,2% 99,4% 72,5% 91,3% (6) 90,4% (6) 0,0% 0,0% Ozônio (2) R<strong>em</strong>oção 46 26 56,34 16,88 39,46 1392 7 1385 2,29 8,23 < 1 < 1 Eficiência 24,1% 74,5% 6,0% 17,0% 0,3% (6) 46,0% (6) 45,6% 5,5% 100,0% 100,0% Dióxido <strong>de</strong> Cloro (3) R<strong>em</strong>oção 12,22 124,37 40 116 44,34 71,63 1.675 25 1.650 5,76 7,61 < 1,8 < 1,8 1.052 Eficiência 59,5% 12,9% 75,0% 8,0% 4,4% 10,1% 2,4% 40,5% 1,4% 0,5% 4,8% 100,0% 100,0% 0,0% Osmose Reversa (4) R<strong>em</strong>oção 2,84 6,67 2,36 0,36 2,01 43,83 0 43,83 0,41 7,26 < 1 < 1 53 Eficiência 98,0% 97,7% 98,1% 99,4% 96,9% 97,6% 100,0% 97,5% 96,1% 17,6% 100,0% 100,0% 94,9% Coagulação- R<strong>em</strong>oção 34,5 20 35,95 12,34 23,61 1497 2 1495 0,76 7,31 Floculação (5) Eficiência 78,8% 95,0% 58,5% 78,9% 16,1% (6) 96,4% (6) 93,9% 21,8% SE - S<strong>em</strong> Especificação encontrada (1) Consi<strong>de</strong>rado os valores <strong>para</strong> o t<strong>em</strong>po <strong>de</strong> contato <strong>de</strong> 20 minutos e uma concentração <strong>de</strong> carvão ativado <strong>de</strong> 0,60 gramas (2) Consi<strong>de</strong>rado os valores do Teste 02 com o t<strong>em</strong>po <strong>de</strong> 15 minutos (3) Consi<strong>de</strong>rado os valores do Teste 02 (4) Consi<strong>de</strong>rado a média dos valores do Teste 02 (5) Consi<strong>de</strong>rado o Teste 03 com o jarro contendo 150 ppm do coagulante Bufloc 5122 e 0,5 ppm do auxiliar <strong>de</strong> coagulação Bufloc 565 (6) Não houve eficiência na r<strong>em</strong>oção do parâmetro Legenda: S<strong>em</strong> padrão estabelecido Aten<strong>de</strong> à diretriz <strong>de</strong> reúso Não aten<strong>de</strong> à diretriz <strong>de</strong> reúso Parâmetro não avaliado
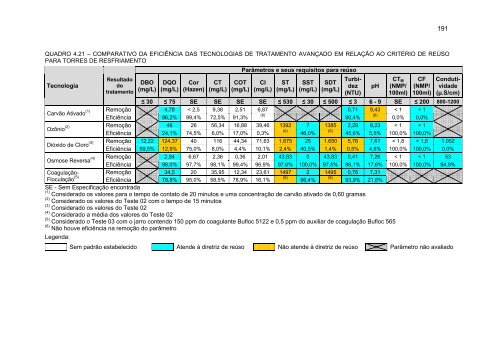
191 QUADRO 4.21 – COMPARATIVO DA EFICIÊNCIA DAS TECNOLOGIAS DE TRATAMENTO AVANÇADO EM RELAÇÃO AO CRITÉRIO DE REÚSO PARA TORRES DE RESFRIAMENTO Parâmetros e seus requisitos <strong>para</strong> reúso Tecnologia Resultado do tratamento DBO (mg/L) DQO (mg/L) Cor (Hazen) CT (mg/L) COT (mg/L) CI (mg/L) ST (mg/L) SST (mg/L) SDT (mg/L) Turbi<strong>de</strong>z (NTU) pH CT M (NMP/ 100ml) CF (NMP/ 100ml) Condutivida<strong>de</strong> (μ.S/cm) ≤ 30 ≤ 75 SE SE SE SE ≤ 530 ≤ 30 ≤ 500 ≤ 3 6 - 9 SE ≤ 200 800-1200 Carvão Ativado (1) R<strong>em</strong>oção 4,78 < 2,5 9,38 2,51 6,87 0,71 9,43 < 1 < 1 Eficiência 96,2% 99,4% 72,5% 91,3% (6) 90,4% (6) 0,0% 0,0% Ozônio (2) R<strong>em</strong>oção 46 26 56,34 16,88 39,46 1392 7 1385 2,29 8,23 < 1 < 1 Eficiência 24,1% 74,5% 6,0% 17,0% 0,3% (6) 46,0% (6) 45,6% 5,5% 100,0% 100,0% Dióxido <strong>de</strong> Cloro (3) R<strong>em</strong>oção 12,22 124,37 40 116 44,34 71,63 1.675 25 1.650 5,76 7,61 < 1,8 < 1,8 1.052 Eficiência 59,5% 12,9% 75,0% 8,0% 4,4% 10,1% 2,4% 40,5% 1,4% 0,5% 4,8% 100,0% 100,0% 0,0% Osmose Reversa (4) R<strong>em</strong>oção 2,84 6,67 2,36 0,36 2,01 43,83 0 43,83 0,41 7,26 < 1 < 1 53 Eficiência 98,0% 97,7% 98,1% 99,4% 96,9% 97,6% 100,0% 97,5% 96,1% 17,6% 100,0% 100,0% 94,9% Coagulação- R<strong>em</strong>oção 34,5 20 35,95 12,34 23,61 1497 2 1495 0,76 7,31 Floculação (5) Eficiência 78,8% 95,0% 58,5% 78,9% 16,1% (6) 96,4% (6) 93,9% 21,8% SE - S<strong>em</strong> Especificação encontrada (1) Consi<strong>de</strong>rado os valores <strong>para</strong> o t<strong>em</strong>po <strong>de</strong> contato <strong>de</strong> 20 minutos e uma concentração <strong>de</strong> carvão ativado <strong>de</strong> 0,60 gramas (2) Consi<strong>de</strong>rado os valores do Teste 02 com o t<strong>em</strong>po <strong>de</strong> 15 minutos (3) Consi<strong>de</strong>rado os valores do Teste 02 (4) Consi<strong>de</strong>rado a média dos valores do Teste 02 (5) Consi<strong>de</strong>rado o Teste 03 com o jarro contendo 150 ppm do coagulante Bufloc 5122 e 0,5 ppm do auxiliar <strong>de</strong> coagulação Bufloc 565 (6) Não houve eficiência na r<strong>em</strong>oção do parâmetro Legenda: S<strong>em</strong> padrão estabelecido Aten<strong>de</strong> à diretriz <strong>de</strong> reúso Não aten<strong>de</strong> à diretriz <strong>de</strong> reúso Parâmetro não avaliado
- Page 1:
AIRTON OENNING JUNIOR AVALIAÇÃO D
- Page 4 and 5:
DEDICATÓRIA A meus pais, Airton (i
- Page 6 and 7:
SUMÁRIO SUMÁRIO .................
- Page 8 and 9:
3.2.1.4. Cor.......................
- Page 10 and 11:
LISTA DE FIGURAS FIGURA 2.1 - O EXE
- Page 12 and 13:
FIGURA 4.21 - PERFIS DO RESIDUAL DE
- Page 14 and 15:
LISTA DE QUADROS QUADRO 2.1 - ESTAT
- Page 16 and 17:
QUADRO 2.36 - ESPECIFICAÇÕES DE Q
- Page 18 and 19:
QUADRO 4.4 - CONSUMO DE OZÔNIO PAR
- Page 20 and 21:
LISTA DE ABREVIATURAS E SIGLAS ABNT
- Page 22 and 23:
THM TTS UF UFC/mL UFPR UFSC UV WHO
- Page 24 and 25:
ABSTRACT The need to minimize the d
- Page 26 and 27:
2 No entanto, este comportamento pr
- Page 28 and 29:
4 oxidação com ozônio, dióxido
- Page 30 and 31:
6 2. REVISÃO BIBLIOGRÁFICA Esta r
- Page 32 and 33:
8 QUADRO 2.3 - ESTATÍSITICA DOS AS
- Page 34 and 35:
10 • A disposição de efluentes
- Page 36 and 37:
12 Nos Estados Unidos, segundo US E
- Page 38 and 39:
14 para servir todos os usos urbano
- Page 40 and 41:
16 Outro exemplo de reúso potável
- Page 42 and 43:
18 QUADRO 2.6 - CRITÉRIOS E DIRETI
- Page 44 and 45:
20 condicionado, prevenção contra
- Page 46 and 47:
22 DBO 5 NE NE QUADRO 2.9 - CRITÉR
- Page 48 and 49:
24 processadas e para pastagem, cul
- Page 50 and 51:
26 DBO 5 NE NE QUADRO 2.13 - CRITÉ
- Page 52 and 53:
28 QUADRO 2.16 - MONITORAMENTO DO T
- Page 54 and 55:
30 QUADRO 2.18 - LIMITES ESTABELECI
- Page 56 and 57:
32 QUADRO 2.19 - TEORES MÁXIMOS PA
- Page 58 and 59:
34 QUADRO 2.19 - TEORES MÁXIMOS PA
- Page 60 and 61:
36 Para os estados americanos exist
- Page 62 and 63:
38 2.2.2.4. Reúso planejado de ág
- Page 64 and 65:
40 QUADRO 2.26 - PRINCIPAIS APLICA
- Page 66 and 67:
42 problemas, mas suas concentraç
- Page 68 and 69:
44 legislação definida. O Quadro
- Page 70 and 71:
46 No Quadro 2.30 a US EPA (2004) a
- Page 72 and 73:
48 QUADRO 2.33 - REQUISITOS DE QUAL
- Page 74 and 75:
50 QUADRO 2.35 - CRITÉRIOS DE QUAL
- Page 76 and 77:
52 Quando as condições hidrogeol
- Page 78 and 79:
54 QUADRO 2.39 - BASE CONCEITUAL PA
- Page 80 and 81:
56 QUADRO 2.40 - DIRETRIZES MICROBI
- Page 82 and 83:
58 carvões especiais (CHEREMISINOF
- Page 84 and 85:
60 FIGURA 2.4 - ESBOÇO DA DEFINIÇ
- Page 86 and 87:
62 vai depender dos compostos adsor
- Page 88 and 89:
64 a, b = constantes empíricas; C
- Page 90 and 91:
66 QUADRO 2.44 - ESPECIFICAÇÕES T
- Page 92 and 93:
68 apresenta a comparação do pote
- Page 94 and 95:
70 2.3.2.2. Tecnologias disponívei
- Page 96 and 97:
72 O ozônio possui alguns inconven
- Page 98 and 99:
74 ⎛100 ⎞ D = U. ⎜ ⎟ (2.6)
- Page 100 and 101:
76 2.3.3. Oxidação Via Dióxido d
- Page 102 and 103:
78 90% de bactérias do grupo colif
- Page 104 and 105:
80 Através do fator CT D , em rela
- Page 106 and 107:
82 2.3.3.5. Impactos ao meio ambien
- Page 108 and 109:
84 2.3.4.1. Classificação dos pro
- Page 110 and 111:
86 o tamanho dos poros tem importâ
- Page 112 and 113:
88 tratamento é usado para reduç
- Page 114 and 115:
90 suspensos e redução de bactér
- Page 116 and 117:
92 para grandes indústrias. O conc
- Page 118 and 119:
94 ocorre dentro de uma faixa deste
- Page 120 and 121:
96 carbônico, polímeros e flocos
- Page 122 and 123:
98 Segundo KIELY (1996) a dose de p
- Page 124 and 125:
100 volume pode ser usada como esti
- Page 126 and 127:
102 As partículas extremamente peq
- Page 128 and 129:
104 • Estruturas metálicas: Clie
- Page 130 and 131:
106 3.1.1.2. O processo de pintura
- Page 132 and 133:
108 FIGURA 3.1 - FLUXOGRAMA DO PROC
- Page 134 and 135:
110 • Tratamento biológico por l
- Page 136 and 137:
112 3.1.1.5. Critérios adotados pa
- Page 138 and 139:
114 QUADRO 3.3 - CARACTERÍSTICAS F
- Page 140 and 141:
116 FIGURA 3.3 - APARELHO DE TESTES
- Page 142 and 143:
118 peróxido de hidrogênio e áci
- Page 144 and 145:
120 • Filtro de polipropileno o M
- Page 146 and 147:
122 • Bomba 2: tipo diafragma, ma
- Page 148 and 149:
124 o Metais pesados (como Pb) 0,00
- Page 150 and 151:
126 • Solubilidade: < 10% a 25/C;
- Page 152 and 153:
128 • Coliformes totais e fecais
- Page 154 and 155:
130 3.2.1.7. CT, COT, CI As anális
- Page 156 and 157:
132 3.2.2.1.1 Determinação do tem
- Page 158 and 159:
134 A unidade de bancada utilizou o
- Page 160 and 161:
136 nos dois testes é apresentada
- Page 162 and 163:
138 intervalos de 20 ppm. No teste
- Page 164 and 165: 140 As informações sobre a quanti
- Page 166 and 167: 142 de tempo de contato. Como os re
- Page 168 and 169: 144 total que influencia na queda d
- Page 170 and 171: 146 com uma massa de 0,60g de carv
- Page 172 and 173: 148 resultado da taxa de adsorção
- Page 174 and 175: 150 QUADRO 4.5 - CONSUMO DE OZÔNIO
- Page 176 and 177: 152 desinfecção ocorreu normalmen
- Page 178 and 179: 154 QUADRO 4.7 - VARIAÇÃO DAS AN
- Page 180 and 181: 156 FIGURA 4.15 - VARIAÇÃO DO CAR
- Page 182 and 183: 158 QUADRO 4.8 - VARIAÇÃO DAS AN
- Page 184 and 185: 160 FIGURA 4.20 - VARIAÇÃO DOS S
- Page 186 and 187: 162 residual ficou em 0,24 ppm. O Q
- Page 188 and 189: 164 O único parâmetro do Quadro 4
- Page 190 and 191: 166 FIGURA 4.22 - VARIAÇÃO DO PH
- Page 192 and 193: 168 elevar e até a ultrapassar a c
- Page 194 and 195: 170 As Figuras 4.26 e 4.27 mostram
- Page 196 and 197: 172 A Figura 4.30 mostra a variaç
- Page 198 and 199: 174 QUADRO 4.15 - VARIAÇÃO DAS AN
- Page 200 and 201: 176 FIGURA 4.33 - VARIAÇÃO DOS S
- Page 202 and 203: 178 FIGURA 4.35 - PERFIS DE VAZÃO
- Page 204 and 205: 180 No caso do CT, COT e CI, as amo
- Page 206 and 207: 182 FIGURA 4.39 - VARIAÇÃO DO CAR
- Page 208 and 209: 184 QUADRO 4.19 - VARIAÇÃO DAS AN
- Page 210 and 211: 186 FIGURA 4.44 - VARIAÇÃO DOS S
- Page 212 and 213: 188 (Quadros 4.20 e 4.21). No caso
- Page 216 and 217: 192 QUADRO 4.22 - COMPARATIVO DA EF
- Page 218 and 219: 194 4.4. AVALIAÇÃO DOS CUSTOS DIR
- Page 220 and 221: 196 cálculo apresentado no Anexo C
- Page 222 and 223: 198 estimado do tratamento do eflue
- Page 224 and 225: 200 alimentação e retrolavagem; b
- Page 226 and 227: 202 QUADRO 4.28 - PLANILHA DE CUSTO
- Page 228 and 229: 204 5. CONCLUSÕES E RECOMENDAÇÕE
- Page 230 and 231: 206 o custo por metro cúbico trata
- Page 232 and 233: 208 REFERÊNCIAS ABNT - ASSOCIAÇÃ
- Page 234 and 235: 210 CONAMA - Conselho Nacional do M
- Page 236 and 237: 212 LAVRADOR FILHO, J., Contribuiç
- Page 238 and 239: 214 RICHARD, D., The cost of wastew
- Page 240 and 241: 216 ANEXO A - Resultados das análi
- Page 242 and 243: 218 ANEXO B - Memorial de cálculo
- Page 244 and 245: 220 QUADRO C.1 - PLANILHA DE CUSTOS
- Page 246 and 247: 222 ANEXO E - Levantamento de custo
- Page 248: 224 Orientador Urivald Pawlowsky Au