p18llemm1plaf1aeo18g180top98.pdf
Create successful ePaper yourself
Turn your PDF publications into a flip-book with our unique Google optimized e-Paper software.
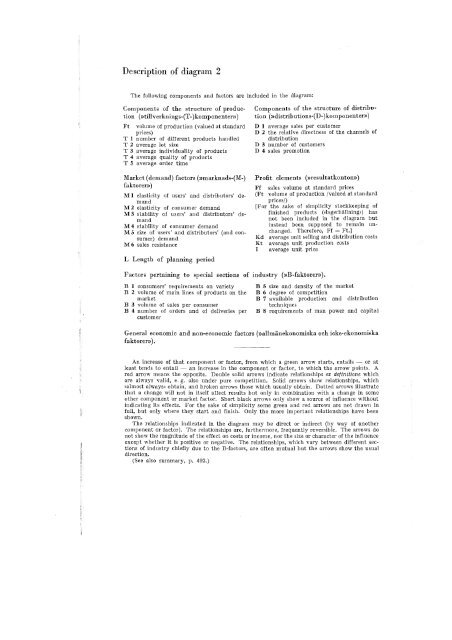
Description of diagram 2<br />
The following components and factors are included in the diagram:<br />
l·<br />
Components of the structure of production<br />
(»tillverknings-(T-)komponenter»)<br />
Ft volume of production (valued at standard<br />
prices)<br />
T 1 number of different products handled<br />
T 2 average lot size<br />
T 3 average individuality of products<br />
T 4 average quality of products<br />
T 5 average order time<br />
Market (demand) factors (»marknads-(M-)<br />
faktorer»)<br />
MIelasticity of users' and distributors' demand<br />
M2 elasticity of consumer demand<br />
M3 stability of users' and distributors' demand<br />
M4 stability of consumer demand<br />
M5 size of users' and distributors' (and consumer)<br />
demand<br />
M6 sales resistanee<br />
L Length of planning period<br />
Components of the structure of distribution<br />
(»distributions-(D-)komponenter»)<br />
D 1 average sales per customer<br />
D2the relative directness of the channels of<br />
distribution<br />
D3number of customers<br />
D 4 sales promotion<br />
Profit elements (»resultatkonton»)<br />
Ff sales volume at standard prices<br />
(Ft volume of production jvalued at standard<br />
pricesf)<br />
[For the sake of simplicity stockkeeping of<br />
finished products (»lagerhållning») has<br />
not been included in the diagram but<br />
instead been supposed to remain unchanged.<br />
Therefore, Ff = Ft.]<br />
Kd average unit selling and distribution costs<br />
Kt average unit production costs<br />
I average unit price<br />
Factors pertaining to special sections of industry (»B-faktorer»).<br />
B 1 consumers' requirements on variety<br />
B 2 volume of main lines of products on the<br />
market<br />
B 3 volume of sales per conSUluer<br />
B 4 number of orders and of deliveries per<br />
customer<br />
B 5 size and density of the market<br />
B 6 degree of competition<br />
B 7 available production and distribution<br />
techniques<br />
B 8 requirements of man power and capital<br />
l,<br />
General economic and non-economic factors (»allmänekonomiska och icke-ekonomiska<br />
faktorer»).<br />
An increase of that component or factor, from which a green arrow starts, entails - or at<br />
least tends to entail - an increase in the component or factor, to which the arrow points. A<br />
red arrow means the opposite. Double solid arrows indicate relationships ex dejinitiol1e which<br />
are aIways valid, e. g. aIso under pure competition. Solid arrows show relatiollships, which<br />
»almost always» obtain, and broken arrows those which usually obtain. Dotted arrows illustrate<br />
that a change will not in itself affect results but only in combination with a change in some<br />
other component or market factor. Short black arrows only showa source of influence without<br />
indicating its effects. For the sake of simplicity some green and red arrows are not drawn in<br />
full, but only where they start and finish. Only the more important relationships have been<br />
shown.<br />
The relationships indicated in the diagram may be direct or indirect (by way of another<br />
component or factor). The relationships are, furthermore, frequently reversible. The arrows do<br />
not sho,v the magnitude of the effect on costs or income, nor the size or character of the influence<br />
except whether it is positive or negative. The relationships, which vary between different sections<br />
of industry chiefly due to the B-factors, are often mutual hut the arrO\\TS show the usual<br />
direction.<br />
(See also summary, p. 492.)


