Attention! Your ePaper is waiting for publication!
By publishing your document, the content will be optimally indexed by Google via AI and sorted into the right category for over 500 million ePaper readers on YUMPU.
This will ensure high visibility and many readers!

Your ePaper is now published and live on YUMPU!
You can find your publication here:
Share your interactive ePaper on all platforms and on your website with our embed function

Simulator 16 User Guide - PowerWorld
Simulator 16 User Guide - PowerWorld
Simulator 16 User Guide - PowerWorld
Create successful ePaper yourself
Turn your PDF publications into a flip-book with our unique Google optimized e-Paper software.
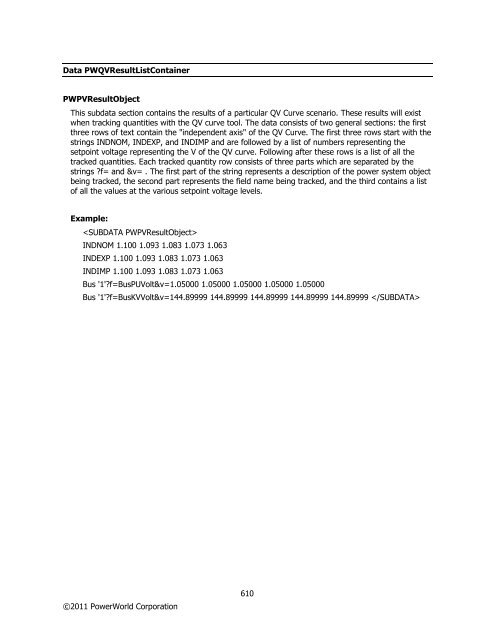
Data PWQVResultListContainer<br />
PWPVResultObject<br />
This subdata section contains the results of a particular QV Curve scenario. These results will exist<br />
when tracking quantities with the QV curve tool. The data consists of two general sections: the first<br />
three rows of text contain the "independent axis" of the QV Curve. The first three rows start with the<br />
strings INDNOM, INDEXP, and INDIMP and are followed by a list of numbers representing the<br />
setpoint voltage representing the V of the QV curve. Following after these rows is a list of all the<br />
tracked quantities. Each tracked quantity row consists of three parts which are separated by the<br />
strings ?f= and &v= . The first part of the string represents a description of the power system object<br />
being tracked, the second part represents the field name being tracked, and the third contains a list<br />
of all the values at the various setpoint voltage levels.<br />
Example:<br />
<br />
INDNOM 1.100 1.093 1.083 1.073 1.063<br />
INDEXP 1.100 1.093 1.083 1.073 1.063<br />
INDIMP 1.100 1.093 1.083 1.073 1.063<br />
Bus '1'?f=BusPUVolt&v=1.05000 1.05000 1.05000 1.05000 1.05000<br />
Bus '1'?f=BusKVVolt&v=144.89999 144.89999 144.89999 144.89999 144.89999 <br />
©2011 <strong>PowerWorld</strong> Corporation<br />
610
Data PWQVResultListContainer PWPVResultObject This subdata section contains the results of a particular QV Curve scenario. These results will exist when tracking quantities with the QV curve tool. The data consists of two general sections: the first three rows of text contain the "independent axis" of the QV Curve. The first three rows start with the strings INDNOM, INDEXP, and INDIMP and are followed by a list of numbers representing the setpoint voltage representing the V of the QV curve. Following after these rows is a list of all the tracked quantities. Each tracked quantity row consists of three parts which are separated by the strings ?f= and &v= . The first part of the string represents a description of the power system object being tracked, the second part represents the field name being tracked, and the third contains a list of all the values at the various setpoint voltage levels. Example: INDNOM 1.100 1.093 1.083 1.073 1.063 INDEXP 1.100 1.093 1.083 1.073 1.063 INDIMP 1.100 1.093 1.083 1.073 1.063 Bus '1'?f=BusPUVolt&v=1.05000 1.05000 1.05000 1.05000 1.05000 Bus '1'?f=BusKVVolt&v=144.89999 144.89999 144.89999 144.89999 144.89999 ©2011 <strong>PowerWorld</strong> Corporation 610
Data QVCurve QVPoints This subdata section contains a list of the QV Curve points calculated for the respect QVCurve. Each line consists of exactly four values: PerUnitVoltage: The per unit voltage of the bus for a QV point. FictitiousMvar: The amount of Mvar injection from the fictitious generator at this QV point. ShuntDeviceMvar: The Mvar injection from any switched shunts at the bus. TotalMvar: The total Mvar injection from switched shunts and the fictitious generator. ReservesMvar: Total amount of Mvar reserves available at the bus. ReservesTotalMvar: Total Mvar injection from the switched shunts, fictitious generator, and available reserves. Example: DATA (QVCURVE, [BusNum,CaseName,qv_VQ0,qv_Q0,qv_Vmax,qv_QVmax,qv_VQmin,qv_Qmin, { qv_Vmin,qv_QVmin,Qinj_Vmax,Qinj_0,Qinj_min,Qinj_Vmin]) 5 "BASECASE" 0.880 0.000 1.100 312.490 0.480 -221.072 0.180 -86.334 191.490 -77.373 -244.075 -89.562 // NOTE: This bus has a constant impedance // switched shunt value of -100 Mvar at it. // V(PU), Q(MVR), Q_shunt(MVR), Q_tot(MVR), Q_res(MVR), Q_tot_res(MVR) } 1.1000, 312.4898, -121.0000, 191.4898, 0.0000, 191.4898 0.9800, 124.6619, -95.9656, 28.6963, 0.0000, 28.6963 0.7800, -96.6202, -60.7808, -157.4010, 0.0000, -157.4010 0.5800, -206.9895, -33.5960, -240.5855, 0.0000, -240.5855 0.3800, -207.4962, -14.4113, -221.9075, 0.0000, -221.9075 0.1800, -86.3336, -3.2284, -89.5620, 0.0000, -89.5620 ©2011 <strong>PowerWorld</strong> Corporation 611
- Page 1:
User’s Guide December 22, 2011 Si
- Page 4 and 5:
PTI RAW File Load Options .........
- Page 6 and 7:
Custom Case Information Display ...
- Page 8 and 9:
Line Per Unit Impedance Calculator
- Page 10 and 11:
Bus View Display ..................
- Page 12 and 13:
Data View .........................
- Page 14 and 15:
Switched Shunt Fields on Onelines .
- Page 16 and 17:
Oneline Animation .................
- Page 18 and 19:
Tapping Transmission Lines.........
- Page 20 and 21:
Tutorial: Contingency Analysis - Pa
- Page 22 and 23:
Determining Set of Active Inequalit
- Page 24 and 25:
ATC Analysis Methods: Single Linear
- Page 26 and 27:
SaveCase Function (version 9) .....
- Page 28 and 29:
Tutorial: Inserting a Transformer P
- Page 30 and 31:
Introduction to PowerWorld Simulato
- Page 32 and 33:
Distributed Computing Distributed c
- Page 34 and 35:
The following are new oneline diagr
- Page 36 and 37:
Added new Custom Monitoring to the
- Page 38 and 39:
control and is required to meet the
- Page 40 and 41:
economic range. Generators that are
- Page 42 and 43:
Bus can be specified by number [BUS
- Page 44 and 45:
Contact Information PowerWorld Corp
- Page 46 and 47:
Example Windows Styles ©2011 Power
- Page 48 and 49:
Edit Mode Introduction The Edit Mod
- Page 50 and 51:
Script Mode Introduction The Script
- Page 52 and 53:
Custom and Memo Display The Custom
- Page 54 and 55:
Ribbons User Interface PowerWorld's
- Page 56 and 57:
on Title Bar Applicati on Button Cl
- Page 58 and 59:
Add Ons Ribbon Tab The Add Ons ribb
- Page 60 and 61:
Topology Processing Ribbon Group To
- Page 62 and 63:
Case Data Ribbon Group Difference F
- Page 64 and 65:
The Open Windows Menu provides a co
- Page 66 and 67:
Clipboard Ribbon Group The Clipboar
- Page 68 and 69:
Formatting Ribbon Group The Formatt
- Page 70 and 71:
Individual Insert Ribbon Group The
- Page 72 and 73:
Quick Insert Ribbon Group The Quick
- Page 74 and 75:
Select Ribbon Group The Select ribb
- Page 76 and 77:
Click on this button to open the di
- Page 78 and 79:
GIS Tools Menu Provides access to m
- Page 80 and 81:
Save View Choose this option to ope
- Page 82 and 83:
Options Ribbon Tab The Options ribb
- Page 84 and 85:
Solution Options Quick Menu The Sol
- Page 86 and 87:
For more detailed help see the Othe
- Page 88 and 89:
©2011 PowerWorld Corporation 60
- Page 90 and 91:
Determine Path Distances to Buses:
- Page 92 and 93:
Power Flow Tools Ribbon Group The m
- Page 94 and 95:
Usually, a flat start should be use
- Page 96 and 97:
Redraws (refreshes) each of the ope
- Page 98 and 99:
Application File Menu The Applicati
- Page 100 and 101:
use, however Simulator does store t
- Page 102 and 103:
When using the Present Topological
- Page 104 and 105:
GE EPC File Load Options The GE EPC
- Page 106 and 107:
PTI RAW File Load Options This dial
- Page 108 and 109:
Opening a Oneline Diagram Simulator
- Page 110 and 111:
Recently Opened Cases A numbered li
- Page 112 and 113:
Building a New Oneline This option
- Page 114 and 115:
Saving a Oneline Select Save Onelin
- Page 116 and 117:
Generator Capability Curves Format
- Page 118 and 119:
Cross-compound is a generator archi
- Page 120 and 121:
Interface Data Format (*.inf) These
- Page 122 and 123:
tGzer, tBzer zero sequence line shu
- Page 124 and 125:
Saving Images as Jpegs Simulator ca
- Page 126 and 127:
Working With GE EPC Files PowerWorl
- Page 128 and 129:
PSLF supports up to 8 owners per br
- Page 130 and 131:
In Simulator, each bus can be optio
- Page 132 and 133:
PowerWorld Project Initialization S
- Page 134 and 135:
The *.pwp file type will now be rec
- Page 136 and 137:
Create Project Dialog The Create Pr
- Page 138 and 139:
Opening an Existing Project To open
- Page 140 and 141:
Fields Pane ©2011 PowerWorld Corpo
- Page 142 and 143:
Model Explorer: Fields Pane The Fie
- Page 144 and 145:
©2011 PowerWorld Corporation 116
- Page 146 and 147:
Configuring the Case Information Di
- Page 148 and 149:
Also note that fields that the Gree
- Page 150 and 151:
Custom Field Descriptions Custom Fi
- Page 152 and 153:
Custom Field Description Dialog The
- Page 154 and 155:
Calculated Fields Calculated fields
- Page 156 and 157:
Case Information Customizations Dis
- Page 158 and 159:
Moves the case information display
- Page 160 and 161:
Case Information Displays: Using Ce
- Page 162 and 163:
Case Information Displays: Finding
- Page 164 and 165:
HTML Table Format Dialog The Table
- Page 166 and 167:
Set contains actions for setting da
- Page 168 and 169:
Case Information Toolbar: Copy, Pas
- Page 170 and 171:
Case Information Toolbar: Filtering
- Page 172 and 173:
Case Information Toolbar: Geo Data
- Page 174 and 175:
Case Information Toolbar: Save Auxi
- Page 176 and 177:
Case Information Toolbar: Records M
- Page 178 and 179:
Case Information Toolbar: Set, Togg
- Page 180 and 181:
Case Information Filterbar On the M
- Page 182 and 183:
Advanced Filtering Filtering by are
- Page 184 and 185:
epresent the filter. If the use of
- Page 186 and 187:
Advanced Filtering: Advanced The Ad
- Page 188 and 189:
Advanced Filtering: Device The Adva
- Page 190 and 191:
Custom Expressions Simulator allows
- Page 192 and 193:
Custom String Expressions Simulator
- Page 194 and 195:
MAX Maximum value ©2011 PowerWorld
- Page 196 and 197:
Model Expressions Model Expressions
- Page 198 and 199:
Similarly, normally you may only en
- Page 200 and 201:
Find Dialog Basics Many times when
- Page 202 and 203:
Search for Text Dialog This dialog
- Page 204 and 205:
Model Filters Display and Dialog Mo
- Page 206 and 207:
Entering a Range of Numbers On a nu
- Page 208 and 209:
Copying Simulator Data to and from
- Page 210 and 211:
Key Fields Key fields are necessary
- Page 212 and 213:
Required Fields Required fields are
- Page 214 and 215:
Contour Column Type Color Map Choos
- Page 216 and 217:
Grid Metrics Dialog The grid metric
- Page 218 and 219:
The uppermost part of the dialog bo
- Page 220 and 221:
Available SubData : lists the SubDa
- Page 222 and 223:
When creating a new geographic data
- Page 224 and 225:
There are two choices of Field Look
- Page 226 and 227:
Stack Level An object's stack level
- Page 228 and 229:
Geographic Data View Styles Each ge
- Page 230 and 231:
Custom Case Information Display To
- Page 232 and 233:
©2011 PowerWorld Corporation 204
- Page 234 and 235:
©2011 PowerWorld Corporation 206
- Page 236 and 237:
Show Fields Secondary This mode is
- Page 238 and 239:
User-Defined Case Information Displ
- Page 240 and 241:
Case Description The Case Descripti
- Page 242 and 243:
Case Summary The Case Summary Displ
- Page 244 and 245:
Power Flow List The Power Flow List
- Page 246 and 247:
Quick Power Flow List The Quick Pow
- Page 248 and 249:
Area Display The Area Display house
- Page 250 and 251:
Zone Display The Zone Display provi
- Page 252 and 253:
Far Area Name, Far Number, Far Name
- Page 254 and 255:
Super Area Display The Super Area D
- Page 256 and 257:
Bus Display The Bus Display present
- Page 258 and 259:
Remotely Regulated Bus Display The
- Page 260 and 261:
Substation Records Display The Subs
- Page 262 and 263:
Minimum and maximum allowable real
- Page 264 and 265:
Generator/Load Cost Models The Gene
- Page 266 and 267:
Parameters used to model the cost c
- Page 268 and 269:
An informational field that can be
- Page 270 and 271:
Unit Type An informational field th
- Page 272 and 273:
Load Benefit Models Display The Loa
- Page 274 and 275:
Line and Transformer Display The Li
- Page 276 and 277:
Merge Line Terminals A transmission
- Page 278 and 279:
200% and 300%. Also series caps and
- Page 280 and 281:
Of particular interest on the dialo
- Page 282 and 283:
section line going to the to bus an
- Page 284 and 285:
For an LTC transformer, this is the
- Page 286 and 287:
Renumber Star Buses... This option
- Page 288 and 289:
DC Lines Display The DC Line Displa
- Page 290 and 291:
Switched Shunt Display The Switched
- Page 292 and 293:
Interface Display The Interface Dis
- Page 294 and 295:
Nomogram Display The Nomogram Displ
- Page 296 and 297:
Indicates the degree to which switc
- Page 298 and 299:
entering changes directly in the ta
- Page 300 and 301:
MAX SHUNT DEC The participation fac
- Page 302 and 303:
Island Display The Island Display p
- Page 304 and 305:
Transaction Dialog The Transaction
- Page 306 and 307:
Owner Data Information Display The
- Page 308 and 309:
Owned Bus Records Display The Owned
- Page 310 and 311:
Owned Generator Records Display The
- Page 312 and 313:
Jacobian Display The Jacobian displ
- Page 314 and 315:
Bus Information (Edit Mode) This di
- Page 316 and 317:
Size Specifies the vertical axis of
- Page 318 and 319:
Bus Name Name of the bus Bus Number
- Page 320 and 321:
Bus Voltage Regulating Devices Dial
- Page 322 and 323:
of the substation object. Use the W
- Page 324 and 325:
Total Load MW or MVAR in the substa
- Page 326 and 327:
There are six additional areas of i
- Page 328 and 329:
Include Suffix If the Include Suffi
- Page 330 and 331:
Generator Options: Power and Voltag
- Page 332 and 333:
For Constant mode, Max Mvar Output
- Page 334 and 335:
The cost shift and cost multiplier
- Page 336 and 337:
Generator Options: Owners, Area, Zo
- Page 338 and 339:
Set Generator Participation Factors
- Page 340 and 341:
Generator Reactive Power Capability
- Page 342 and 343:
Substation Number, Substation Name
- Page 344 and 345:
Load Options: OPF Load Dispatch Thi
- Page 346 and 347:
Anchored If the Anchored checkbox i
- Page 348 and 349:
Branch Options (Edit Mode) The Bran
- Page 350 and 351:
The Memo section of the dialog is s
- Page 352 and 353:
Branch Options: Parameters The Para
- Page 354 and 355:
Line Per Unit Impedance Calculator
- Page 356 and 357:
values section. The characteristic
- Page 358 and 359:
Frequency: Frequency of the system
- Page 360 and 361:
GMR Geometric mean radius given in
- Page 362 and 363:
The distributed series impedance an
- Page 364 and 365:
Where: LimAmp Limit in Amperes LimM
- Page 366 and 367:
dialog allows changing the control
- Page 368 and 369:
Transformer AVR Dialog The Transfor
- Page 370 and 371:
Branch Options: Series Capacitor Th
- Page 372 and 373:
Save Saves any modifications but do
- Page 374 and 375:
AC Line MVA Flow Magnitude of MVA f
- Page 376 and 377:
Transformer Field Options Dialog Tr
- Page 378 and 379:
DC Transmission Line Options This d
- Page 380 and 381:
specify power flow at the inverter
- Page 382 and 383:
DC Line Options: Inverter Parameter
- Page 384 and 385:
DC Line Options: OPF This page is u
- Page 386 and 387:
Specifies the DC control mode for e
- Page 388 and 389:
Multi-Terminal DC Record Informatio
- Page 390 and 391:
Multi-Terminal DC Converter Informa
- Page 392 and 393:
Multi-Terminal DC Line Information
- Page 394 and 395:
dialog allows changing the control
- Page 396 and 397:
Transformers Bases and Impedances D
- Page 398 and 399:
Transformer AVR Dialog The Transfor
- Page 400 and 401:
Transformer Mvar Control Dialog The
- Page 402 and 403:
Transformer Phase Shifting Dialog T
- Page 404 and 405:
Transformer Field Options Dialog Tr
- Page 406 and 407:
Three Winding Transformer Informati
- Page 408 and 409:
Switched Shunt Information (Edit Mo
- Page 410 and 411:
MW components, and this field will
- Page 412 and 413:
Include Suffix If the Include Suffi
- Page 414 and 415:
©2011 PowerWorld Corporation Custo
- Page 416 and 417:
Each bus is associated with an Owne
- Page 418 and 419:
Bus Voltage Regulating Devices Dial
- Page 420 and 421:
©2011 PowerWorld Corporation Buses
- Page 422 and 423:
Read-only check-box that indicates
- Page 424 and 425:
Designates whether or not the gener
- Page 426 and 427:
Generator Options: Costs The Costs
- Page 428 and 429:
Generator Information: OPF The fiel
- Page 430 and 431:
Load Information (Run Mode) The Loa
- Page 432 and 433:
Branch Information Dialog (Run Mode
- Page 434 and 435:
Maximum MVA Flow The largest MVA fl
- Page 436 and 437:
Transformer AVR Dialog The Transfor
- Page 438 and 439:
Transformer Mvar Control Dialog The
- Page 440 and 441:
Transformer Phase Shifting Dialog T
- Page 442 and 443:
Transformer Impedance Correction Ta
- Page 444 and 445:
Nominal Mvar ©2011 PowerWorld Corp
- Page 446 and 447:
Zone Information (Run Mode) This di
- Page 448 and 449:
Labels Using Labels for Identificat
- Page 450 and 451:
ATC Extra Monitors ATC Extra Monito
- Page 452 and 453:
Latitude/Longitude and UTM Coordina
- Page 454 and 455:
Area Information The Area Informati
- Page 456 and 457:
Area Information: Buses The Area Bu
- Page 458 and 459:
Area Information: Loads The Area Lo
- Page 460 and 461:
Area Information: Info/Interchange
- Page 462 and 463:
Area Information: Tie Lines The Tie
- Page 464 and 465:
Area Information: Custom The Custom
- Page 466 and 467:
Include Suffix If the Include Suffi
- Page 468 and 469:
generation in the super area by rat
- Page 470 and 471:
Super Area Field Information Super
- Page 472 and 473:
Interface Information The Interface
- Page 474 and 475:
Interface Element Information The I
- Page 476 and 477:
Interface Pie Chart Information Dia
- Page 478 and 479:
Nomogram Information Dialog The Nom
- Page 480 and 481:
Injection Group Overview An injecti
- Page 482 and 483:
Auto Insert Injection Groups Many t
- Page 484 and 485:
Deleting Injection Groups To delete
- Page 486 and 487:
Indicates the degree to which switc
- Page 488 and 489:
entering changes directly in the ta
- Page 490 and 491:
Participation Points Overview A par
- Page 492 and 493:
MAX SHUNT DEC The participation fac
- Page 494 and 495:
Add Participation Points Dialog The
- Page 496 and 497:
Transaction Dialog The Transaction
- Page 498 and 499:
Bus View Display The Bus View Displ
- Page 500 and 501:
Open Multiple Bus Views This option
- Page 502 and 503:
Labels Using Labels for Identificat
- Page 504 and 505:
ATC Scenarios ATC Scenario change r
- Page 506 and 507:
Difference Flows The Difference Flo
- Page 508 and 509:
Using Difference Flows To use the D
- Page 510 and 511:
Present Topological Differences fro
- Page 512 and 513:
Auxiliary Files PowerWorld has inco
- Page 514 and 515:
Script Command Execution Dialog The
- Page 516 and 517:
Script Section The SCRIPT section b
- Page 518 and 519:
OpenCase ("filename ", AppendCa se
- Page 520 and 521:
LOAD MW [P,Q] BUS GEN FACTOR [P] (m
- Page 522 and 523:
DeleteIncludingContents(objecttype,
- Page 524 and 525:
different objects and save these in
- Page 526 and 527:
Use this action to treat the remain
- Page 528 and 529:
UseAreaZone : An optional parameter
- Page 530 and 531:
GenForceLDC_RCC(filter); Use this a
- Page 532 and 533:
[start] : same as the starting plac
- Page 534 and 535:
OWNER: Means that the elements will
- Page 536 and 537:
"OnelineName": The name of the onel
- Page 538 and 539:
RenumberMSLineDummyBuses ("filename
- Page 540 and 541:
Use this action to merge a set of b
- Page 542 and 543:
[value1, …, value8]: The set of r
- Page 544 and 545:
CalculateTLRMultipleElement (TypeEl
- Page 546 and 547:
CalculateLODF([BRANCH nearbusnum fa
- Page 548 and 549:
[AREA num], [AREA "name"], [AREA "l
- Page 550 and 551:
SetSensitivitiesAtOutOfServiceToClo
- Page 552 and 553:
"filename2" The filename of the aux
- Page 554 and 555:
DiffFlowMode(diffmode); Call this a
- Page 556 and 557:
CTGWriteResultsAndOptions("filename
- Page 558 and 559:
©2011 PowerWorld Corporation 530
- Page 560 and 561:
ATCIncreaseTransferBy(amount); Call
- Page 562 and 563:
Script PV Related Actions The follo
- Page 564 and 565:
Script QV Related Actions The follo
- Page 566 and 567:
Script Topology Processing Related
- Page 568 and 569:
Script Transient Stability Related
- Page 570 and 571:
Loads transient stability data in t
- Page 572 and 573:
Data Argument List The DATA argumen
- Page 574 and 575:
note that blank rows are ignored Ar
- Page 576 and 577:
Data List After the data argument l
- Page 578 and 579:
Data ATC_Options RLScenarioName GSc
- Page 580 and 581:
Data ATCScenario TransferLimiter Th
- Page 582 and 583:
Data AuxFileExportFormatData DataBl
- Page 584 and 585:
Data BGCalculatedField Condition Ca
- Page 586 and 587:
Data BusViewFormOptions BusViewBusF
- Page 588 and 589: Data Contingency CTGElementAppend T
- Page 590 and 591: Overview topic. Note: bus# values m
- Page 592 and 593: as close to the desired amount with
- Page 594 and 595: BAMP "1 3 1 1 FROMTO" 271.94031 398
- Page 596 and 597: Data CTGElementBlock CTGElement Thi
- Page 598 and 599: Data CustomColors CustomColors Thes
- Page 600 and 601: Data DynamicFormatting DynamicForma
- Page 602 and 603: Data Filter Condition Conditions st
- Page 604 and 605: Data Gen BidCurve BidCurve subdata
- Page 606 and 607: FieldValue RotationAngle 1.000 -90.
- Page 608 and 609: Data HintDefValues HintObject Store
- Page 610 and 611: Note: PartPoint object types can al
- Page 612 and 613: measurefarend is set to true, there
- Page 614 and 615: Data LimitSet LimitCost LimitCost r
- Page 616 and 617: Data LPVariable LPVariableCostSegme
- Page 618 and 619: Data ModelExpression LookupTable Lo
- Page 620 and 621: Data ModelFilter ModelCondition A M
- Page 622 and 623: MTDCConvType: Converter type. MTDCM
- Page 624 and 625: } 5 "CELILO4P" 0 9999.00 497.92 40
- Page 626 and 627: Data Nomogram InterfaceElementA Int
- Page 628 and 629: Data Owner Bus This subdata section
- Page 630 and 631: Data PieChartGaugeStyle ColorMap Th
- Page 632 and 633: Data PWCaseInformation PWCaseHeader
- Page 634 and 635: Data PWLPOPFCTGViol OPFControlSense
- Page 636 and 637: Data PWPVResultListContainer PWPVRe
- Page 640 and 641: Data QVCurve_Options Sim_Solution_O
- Page 642 and 643: This subdata section contains a lis
- Page 644 and 645: Data StudyMWTransactions ImportExpo
- Page 646 and 647: Data TSSchedule SchedPointList This
- Page 648 and 649: Data View ScreenLayer This is a lis
- Page 650 and 651: Script Actions for Display Auxiliar
- Page 652 and 653: InsertTextFields : (optional) inser
- Page 654 and 655: SetData SaveData SaveDataWithExtra
- Page 656 and 657: Data Argument List for Display Auxi
- Page 658 and 659: Data Key Fields for Display Auxilia
- Page 660 and 661: Special Data Sections There are sev
- Page 662 and 663: Data Common Sections ColorMap Same
- Page 664 and 665: Data PieChartGaugeStyle ColorMap Th
- Page 666 and 667: Simulator Options Simulator provide
- Page 668 and 669: Power Flow Solution: Common Options
- Page 670 and 671: Sensitivity Only option. As the sol
- Page 672 and 673: Disable Power Flow Optimal Multipli
- Page 674 and 675: Enforce Convex Cost Curves in ED Th
- Page 676 and 677: A user-specified comment string tha
- Page 678 and 679: If checked, then each generator’s
- Page 680 and 681: approximation are dependent on the
- Page 682 and 683: Power Flow Solution: General The fo
- Page 684 and 685: Message Log Options Show Log If che
- Page 686 and 687: Environment Options The Environment
- Page 688 and 689:
Oneline Options These options are a
- Page 690 and 691:
This option is used to show the one
- Page 692 and 693:
Save as Auxiliary File Data Format
- Page 694 and 695:
File Management Options There are t
- Page 696 and 697:
Else -- Disconnect The Defined rule
- Page 698 and 699:
After Simulator solves a system suc
- Page 700 and 701:
Solving the Power Flow At its heart
- Page 702 and 703:
©2011 PowerWorld Corporation 674
- Page 704 and 705:
Area Control One of the most import
- Page 706 and 707:
outine, all piecewise linear curves
- Page 708 and 709:
Area Load and Generation Chart The
- Page 710 and 711:
Area MW Transactions Chart The Sche
- Page 712 and 713:
Edit Mode Overview The Edit Mode is
- Page 714 and 715:
use Select By Criteria to select al
- Page 716 and 717:
Oneline Display Options The Oneline
- Page 718 and 719:
Inserting and Placing Multiple Disp
- Page 720 and 721:
then typing in the new value. Other
- Page 722 and 723:
Area Display Objects Area records i
- Page 724 and 725:
Zone Display Objects Zone records i
- Page 726 and 727:
Super Area Display Objects Super ar
- Page 728 and 729:
Owner Display Objects Owner records
- Page 730 and 731:
Area Fields on Onelines Area fields
- Page 732 and 733:
If the Include Suffix checkbox is c
- Page 734 and 735:
Owner Fields on Onelines Owner fiel
- Page 736 and 737:
Bus Fields on Onelines Bus field ob
- Page 738 and 739:
Old Voltage Gauge Options Dialog Th
- Page 740 and 741:
Substation Fields on Onelines To di
- Page 742 and 743:
Generator Fields on Onelines Genera
- Page 744 and 745:
Load Fields on Onelines Load field
- Page 746 and 747:
Line Fields on Onelines Line field
- Page 748 and 749:
Line Flow Pie Charts on Onelines Th
- Page 750 and 751:
Line Flow Gauge Options Dialog The
- Page 752 and 753:
DC Transmission Line Display Object
- Page 754 and 755:
Transformer Display Objects Transfo
- Page 756 and 757:
Transformer Fields on Onelines Tran
- Page 758 and 759:
This is the vertical size of the ob
- Page 760 and 761:
Series Capacitor Fields on Onelines
- Page 762 and 763:
Switched Shunt Fields on Onelines S
- Page 764 and 765:
Automatically Inserting Interface D
- Page 766 and 767:
InterArea Flow Options Dialog This
- Page 768 and 769:
Loading NERC Flowgates This command
- Page 770 and 771:
Injection Group Display Objects Inj
- Page 772 and 773:
the location where you would like t
- Page 774 and 775:
Background Lines on Onelines The ba
- Page 776 and 777:
Background Rectangles on Onelines T
- Page 778 and 779:
Background Pictures on Onelines The
- Page 780 and 781:
Converting Background Ellipses Back
- Page 782 and 783:
Oneline Fields The Oneline Fields a
- Page 784 and 785:
Memo Text Memo Text display objects
- Page 786 and 787:
Supplemental Data Fields on Oneline
- Page 788 and 789:
Only Apply Warning/Limit Colors and
- Page 790 and 791:
Pie Charts/Gauges: Pie Chart/Gauge
- Page 792 and 793:
Pie Chart / Gauge Dialogs There are
- Page 794 and 795:
When checked, any sizing of pie cha
- Page 796 and 797:
Standard Parameters Open Parameter
- Page 798 and 799:
When checked, discrete colors will
- Page 800 and 801:
Pie Chart / Gauge Style Dialog - Pi
- Page 802 and 803:
upon where the field value falls wi
- Page 804 and 805:
Palette Overview The display object
- Page 806 and 807:
Lists those objects defined in the
- Page 808 and 809:
Quick Insert Ribbon Group The Quick
- Page 810 and 811:
Automatically Inserting Buses Simul
- Page 812 and 813:
This area deals with lines used as
- Page 814 and 815:
Automatically Inserting Loads The A
- Page 816 and 817:
Automatically Inserting Interface D
- Page 818 and 819:
Automatically Inserting Borders Pow
- Page 820 and 821:
draw borders of other countries aro
- Page 822 and 823:
The Cut Command is used in the Edit
- Page 824 and 825:
match the chosen criteria will rema
- Page 826 and 827:
Grid/Highlight Unlinked Objects The
- Page 828 and 829:
Setting Background Color The Backgr
- Page 830 and 831:
Enter a desired location for the ce
- Page 832 and 833:
Formatting Ribbon Group The Formatt
- Page 834 and 835:
Format Multiple Objects The Format
- Page 836 and 837:
Font Properties The Font Tab allows
- Page 838 and 839:
Levels/Layers Options The Levels/La
- Page 840 and 841:
Screen Layer Options The Screen Lay
- Page 842 and 843:
Display/Size Properties Use the Dis
- Page 844 and 845:
Refresh Anchors The Refresh Anchors
- Page 846 and 847:
The Cut Command is used in the Edit
- Page 848 and 849:
Oneline Diagram Overview The purpos
- Page 850 and 851:
Custom Hint Values Simulator can be
- Page 852 and 853:
Oneline Local Menu The local menu p
- Page 854 and 855:
Oneline Display Options Dialog The
- Page 856 and 857:
Use Absolute Values for MW Interfac
- Page 858 and 859:
©2011 PowerWorld Corporation 830
- Page 860 and 861:
Determines the relative density of
- Page 862 and 863:
Thumbnail View The thumbnail view a
- Page 864 and 865:
Display Object Options The Display
- Page 866 and 867:
Substation Display Options The Subs
- Page 868 and 869:
Oneline Animation An important feat
- Page 870 and 871:
Display Explorer The Display Object
- Page 872 and 873:
List Unlinked Display Objects An un
- Page 874 and 875:
All Display Objects This display wo
- Page 876 and 877:
Either select an existing Classific
- Page 878 and 879:
Map Projections Background on Map P
- Page 880 and 881:
Maps made using PowerWorld's built-
- Page 882 and 883:
Great Circle Distance Dialog To fin
- Page 884 and 885:
Populate Lon,Lat with Display X,Y T
- Page 886 and 887:
Shape File Import Simulator allows
- Page 888 and 889:
GIS Shapefile Data: Identify After
- Page 890 and 891:
GIS Shapefile Data: Format After us
- Page 892 and 893:
Shapefile Database Record Dialog Th
- Page 894 and 895:
labeled Use as a filter on presentl
- Page 896 and 897:
Delete All Measure Lines All measur
- Page 898 and 899:
Closet Facilities to Point To produ
- Page 900 and 901:
Oneline Zooming and Panning All one
- Page 902 and 903:
Save View Level Dialog The Save Vie
- Page 904 and 905:
Window Ribbon Tab The Window ribbon
- Page 906 and 907:
Load Auxiliary Choose this option t
- Page 908 and 909:
Keyboard Short Cut Actions Dialog T
- Page 910 and 911:
Printing Oneline Diagrams To print
- Page 912 and 913:
To remove a grid section from the p
- Page 914 and 915:
Contouring Simulator can create and
- Page 916 and 917:
Contour Type Contour Type options c
- Page 918 and 919:
Break High This value is used by so
- Page 920 and 921:
Contour Type Options Object Simulat
- Page 922 and 923:
Custom Color Map Custom Color Maps
- Page 924 and 925:
Functional Description of Contour O
- Page 926 and 927:
egion higher will result in each da
- Page 928 and 929:
Dynamic Formatting Overview The Dyn
- Page 930 and 931:
Checking this box will display the
- Page 932 and 933:
Difference Flows: Case Types When u
- Page 934 and 935:
©2011 PowerWorld Corporation Expan
- Page 936 and 937:
Tabular listings of all objects tha
- Page 938 and 939:
Limit Monitoring Settings and Limit
- Page 940 and 941:
Contingency Limit Low PU Volt: Bus'
- Page 942 and 943:
Interface Percentage: The percentag
- Page 944 and 945:
When doing contingency analysis and
- Page 946 and 947:
Difference Flows The Difference Flo
- Page 948 and 949:
Using Difference Flows To use the D
- Page 950 and 951:
Present Topological Differences fro
- Page 952 and 953:
Scaling Use the Power System Scalin
- Page 954 and 955:
Checking the Scale in Merit Order o
- Page 956 and 957:
Path Distances from Bus or Group To
- Page 958 and 959:
Find Circulating MW or MVAr Flows D
- Page 960 and 961:
Shows the maximum percent MVA flow
- Page 962 and 963:
Find Branches that Create Islands T
- Page 964 and 965:
Facility Analysis Dialog This dialo
- Page 966 and 967:
Augmenting Path Max Flow Min Cut Al
- Page 968 and 969:
Governor Power Flow The Governor Po
- Page 970 and 971:
Governor Power Flow: Options Tab Th
- Page 972 and 973:
the Set Corresponding Areas to Part
- Page 974 and 975:
Network Cut The Network Cut tool is
- Page 976 and 977:
Create New Areas for Islands When a
- Page 978 and 979:
Browse PWB File Headers The Browse
- Page 980 and 981:
Unused Bus Numbers When making chan
- Page 982 and 983:
Equivalents Display The Equivalents
- Page 984 and 985:
using perhaps another program, and
- Page 986 and 987:
Select Buses using a Network Cut A
- Page 988 and 989:
Merging Buses Two or more buses can
- Page 990 and 991:
Split Bus Dialog The Split Bus dial
- Page 992 and 993:
Potential Misplacements Dialog In t
- Page 994 and 995:
Automatic Line Tap Dialog The Autom
- Page 996 and 997:
Merge Line Terminals A transmission
- Page 998 and 999:
Bus Renumbering: Automatic Setup of
- Page 1000 and 1001:
Bus Renumbering: Bus Change Options
- Page 1002 and 1003:
Power Transfer Distribution Factors
- Page 1004 and 1005:
Automatically Recalculate If checke
- Page 1006 and 1007:
Shows the transaction distribution
- Page 1008 and 1009:
Directions Dialog Directions are ob
- Page 1010 and 1011:
Calculate MW-Distance Simulator can
- Page 1012 and 1013:
Line Outage Distribution Factors (L
- Page 1014 and 1015:
Line Outage Distribution Factors Di
- Page 1016 and 1017:
This is the LODF value for the inte
- Page 1018 and 1019:
Transmission Loading Relief Sensiti
- Page 1020 and 1021:
TLR Sensitivities Specify if the ne
- Page 1022 and 1023:
TLR Multiple Device Type The Multip
- Page 1024 and 1025:
Generation Shift Factor Sensitiviti
- Page 1026 and 1027:
The loss sensitivities are calculat
- Page 1028 and 1029:
Flow and Voltage Sensitivities To a
- Page 1030 and 1031:
After clicking Calculate Sensitivit
- Page 1032 and 1033:
Sensitivity: dQ/dControl (Mvar/cont
- Page 1034 and 1035:
Click this button to show the Load
- Page 1036 and 1037:
Contingency Analysis: An Introducti
- Page 1038 and 1039:
Three-Winding Transformers Opening
- Page 1040 and 1041:
Contingency Analysis Power Flow Sol
- Page 1042 and 1043:
Contingency Case References - State
- Page 1044 and 1045:
The following options can be set as
- Page 1046 and 1047:
Contingency Case References - Refer
- Page 1048 and 1049:
Auto Insert Contingencies Simulator
- Page 1050 and 1051:
Identify … using prefix These fou
- Page 1052 and 1053:
PSS/E Contingency Format Simulator
- Page 1054 and 1055:
Saving Contingency Records to a Fil
- Page 1056 and 1057:
Contingency Global Actions Continge
- Page 1058 and 1059:
Contingency Analysis Dialog Overvie
- Page 1060 and 1061:
Other Contingency Actions By clicki
- Page 1062 and 1063:
anch or interface violation be affe
- Page 1064 and 1065:
o Auxiliary File (all contingency r
- Page 1066 and 1067:
Contingency Definition Display The
- Page 1068 and 1069:
Contingency Violations Display The
- Page 1070 and 1071:
Contingency Definition Dialog The C
- Page 1072 and 1073:
found, then when running the analys
- Page 1074 and 1075:
Contingency Options: Modeling Basic
- Page 1076 and 1077:
Simulator models this by temporaril
- Page 1078 and 1079:
Contingency Options: Bus Load Throw
- Page 1080 and 1081:
Contingency Options: Generator Line
- Page 1082 and 1083:
Contingency Options: Limit Monitori
- Page 1084 and 1085:
Decrease in low bus voltage - This
- Page 1086 and 1087:
Monitoring Exceptions These options
- Page 1088 and 1089:
Define Monitoring Exceptions Dialog
- Page 1090 and 1091:
Custom Monitors Custom Monitors can
- Page 1092 and 1093:
Contingency Options: Contingency De
- Page 1094 and 1095:
Contingency Options: Miscellaneous
- Page 1096 and 1097:
Contingency Results: View Results B
- Page 1098 and 1099:
Contingency Definition Display The
- Page 1100 and 1101:
Contingency Options Tab: Report Wri
- Page 1102 and 1103:
Contingency Results: Summary These
- Page 1104 and 1105:
This is the list to which the Contr
- Page 1106 and 1107:
The limit of the element in the com
- Page 1108 and 1109:
Contingency Element Dialog The Cont
- Page 1110 and 1111:
Open The Open action will set the S
- Page 1112 and 1113:
Percent,MW, or Mvar. The load amoun
- Page 1114 and 1115:
Bus The Set To action will set the
- Page 1116 and 1117:
their relative participation factor
- Page 1118 and 1119:
Change By The Change By action will
- Page 1120 and 1121:
Make-up Power Sources Power injecti
- Page 1122 and 1123:
this breaker disconnects the device
- Page 1124 and 1125:
Contingency Make-Up Sources Dialog
- Page 1126 and 1127:
Tutorial: Contingency Analysis - Pa
- Page 1128 and 1129:
Power injection contingency actions
- Page 1130 and 1131:
Click to remove the checkmark in Us
- Page 1132 and 1133:
Note: The Refresh Displays after Ea
- Page 1134 and 1135:
Tutorial: Contingency Analysis - Pa
- Page 1136 and 1137:
Tutorial: Contingency Analysis - Pa
- Page 1138 and 1139:
Tutorial: Contingency Analysis - Pa
- Page 1140 and 1141:
©2011 PowerWorld Corporation 1 2 3
- Page 1142 and 1143:
Time Step Simulation The Time Step
- Page 1144 and 1145:
If you are in the Summary page, the
- Page 1146 and 1147:
3. Paused: When the user has paused
- Page 1148 and 1149:
Time Step Simulation Toolbar The pu
- Page 1150 and 1151:
Time Step Simulation: Summary The S
- Page 1152 and 1153:
Time Step Simulation: Summary Local
- Page 1154 and 1155:
Matrix Grids Matrix Grids are a spe
- Page 1156 and 1157:
This is a matrix grid that shows in
- Page 1158 and 1159:
Time Average MVA Marginal Cost Max
- Page 1160 and 1161:
Time Step Simulation: Results The r
- Page 1162 and 1163:
Time Step Simulation: Results Grids
- Page 1164 and 1165:
During OPF and SCOPF simulations, h
- Page 1166 and 1167:
The contouring diagrams generated a
- Page 1168 and 1169:
Time Step Simulation: New Timepoint
- Page 1170 and 1171:
Time Step Simulation: TSB Case Desc
- Page 1172 and 1173:
Press this button to filter the lis
- Page 1174 and 1175:
Time Step Simulation: Setting up Sc
- Page 1176 and 1177:
Use these buttons to move by one we
- Page 1178 and 1179:
Time Step Simulation: Schedules The
- Page 1180 and 1181:
Time Step Simulation: Schedule Subs
- Page 1182 and 1183:
Time Step Simulation: Schedule Subs
- Page 1184 and 1185:
Time Step Simulation: Application o
- Page 1186 and 1187:
Switched Shunt Control: Time Step O
- Page 1188 and 1189:
The secondary regulation range work
- Page 1190 and 1191:
Time Step Actions Time Step Actions
- Page 1192 and 1193:
Once a transformer has been outside
- Page 1194 and 1195:
Time Step Simulation: Running a Tim
- Page 1196 and 1197:
constraints: transmission line ther
- Page 1198 and 1199:
Time Step Simulation: Storing Input
- Page 1200 and 1201:
Fault Analysis Dialog The Fault Ana
- Page 1202 and 1203:
Fault Analysis Generator Records Th
- Page 1204 and 1205:
Mutual Impedance Records The Mutual
- Page 1206 and 1207:
Fault Analysis Load Records This di
- Page 1208 and 1209:
PowerWorld Simulator PV/QV Overview
- Page 1210 and 1211:
PV Curves Dialog To display this di
- Page 1212 and 1213:
PV Curves: Setup The Setup tab is f
- Page 1214 and 1215:
it has arrived at the voltage colla
- Page 1216 and 1217:
The PV curve tool is designed to ra
- Page 1218 and 1219:
PV Curves Setup: Advanced Options T
- Page 1220 and 1221:
This option will change the load at
- Page 1222 and 1223:
If during the reverse transfer proc
- Page 1224 and 1225:
tracking that would just take up co
- Page 1226 and 1227:
Generation MW/Mvar - total real or
- Page 1228 and 1229:
PV Curves: Limit Violations The Lim
- Page 1230 and 1231:
ecause they are radial because they
- Page 1232 and 1233:
200.0000,200.0000,-193.4265, 0.9928
- Page 1234 and 1235:
PV Curves: QV Setup The QV Setup ta
- Page 1236 and 1237:
PV Curves: PV Results The PV Result
- Page 1238 and 1239:
Plot Track Limits ©2011 PowerWorld
- Page 1240 and 1241:
found on the Common Options sub-tab
- Page 1242 and 1243:
This option is available when choos
- Page 1244 and 1245:
NO and back again by double-clickin
- Page 1246 and 1247:
PV Curves New Plots The New Plots p
- Page 1248 and 1249:
To use the QV Curves tool, select Q
- Page 1250 and 1251:
Clicking this button will prompt fo
- Page 1252 and 1253:
Step Size Increment between voltage
- Page 1254 and 1255:
QV Curves Options: Solution These o
- Page 1256 and 1257:
QV Curves Options: Contingencies Th
- Page 1258 and 1259:
QV Curves Options: Output These opt
- Page 1260 and 1261:
If curves are not plotted at they a
- Page 1262 and 1263:
PV/QV Quantities to Track Specifica
- Page 1264 and 1265:
Note: all branches (whether transmi
- Page 1266 and 1267:
To track the limits of any of these
- Page 1268 and 1269:
QV Curves Results: Listing The List
- Page 1270 and 1271:
PV/QV Curves Results: Plot Plotting
- Page 1272 and 1273:
PV/QV Curves Results: Track Limits
- Page 1274 and 1275:
Close Click this button to close th
- Page 1276 and 1277:
OPF Objective Function The objectiv
- Page 1278 and 1279:
OPF Equality Constraints Area MW In
- Page 1280 and 1281:
Each branch that is active for enfo
- Page 1282 and 1283:
OPF Unenforceable Constraints The g
- Page 1284 and 1285:
OPF Primal LP Go to the Add Ons rib
- Page 1286 and 1287:
OPF Options and Results The OPF Opt
- Page 1288 and 1289:
shifting transformer, and to avoid
- Page 1290 and 1291:
CA (contingency analysis) and SCOPF
- Page 1292 and 1293:
done if the Generator Cost Modeling
- Page 1294 and 1295:
OPF Options: Advanced Options Detec
- Page 1296 and 1297:
©2011 PowerWorld Corporation Line
- Page 1298 and 1299:
OPF Options: All LP Variables The O
- Page 1300 and 1301:
OPF Options: LP Basis Matrix The OP
- Page 1302 and 1303:
OPF Options: Bus MVAR Marginal Pric
- Page 1304 and 1305:
OPF Options: Inverse of LP Basis Th
- Page 1306 and 1307:
OPF Area Records Displays OPF speci
- Page 1308 and 1309:
OPF Bus Records Displays OPF specif
- Page 1310 and 1311:
"No" - Generator is NOT available a
- Page 1312 and 1313:
OPF Interface Records Displays OPF
- Page 1314 and 1315:
OPF Line/Transformer Records Displa
- Page 1316 and 1317:
OPF Load Records Displays OPF speci
- Page 1318 and 1319:
OPF Super Area Records Displays OPF
- Page 1320 and 1321:
OPF Controls The following classes
- Page 1322 and 1323:
OPF Example - Introduction As a sim
- Page 1324 and 1325:
B7OPF Case Solved using LP OPF with
- Page 1326 and 1327:
OPF Example - Super Areas To jointl
- Page 1328 and 1329:
OPF Example - Enforcing Line MVA Co
- Page 1330 and 1331:
Security Constrained Optimal Power
- Page 1332 and 1333:
SCOPF Dialog The SCOPF dialog allow
- Page 1334 and 1335:
SCOPF Results The Results page of t
- Page 1336 and 1337:
SCOPF Equality Constraints The SCOP
- Page 1338 and 1339:
Each branch that is active for enfo
- Page 1340 and 1341:
the SCOPF does not resolve the cont
- Page 1342 and 1343:
SCOPF CTG Violations The contingenc
- Page 1344 and 1345:
SCOPF LP Solution Details The LP So
- Page 1346 and 1347:
At Breakpoint Yes, if the LP variab
- Page 1348 and 1349:
SCOPF LP Basis Matrix The LP Basis
- Page 1350 and 1351:
SCOPF Bus Marginal Controls This di
- Page 1352 and 1353:
©2011 PowerWorld Corporation B7SCO
- Page 1354 and 1355:
SCOPF Example: Marginal Prices Usin
- Page 1356 and 1357:
Optimal Power Flow Reserves Overvie
- Page 1358 and 1359:
OPF Reserves Controls Generators ca
- Page 1360 and 1361:
OPF Reserves Constraints Reserve co
- Page 1362 and 1363:
OPF Reserves Objective Function The
- Page 1364 and 1365:
OPF Reserves Case Information Displ
- Page 1366 and 1367:
Then, let us set up the following r
- Page 1368 and 1369:
It should be mentioned that OPF Res
- Page 1370 and 1371:
Available Transfer Capability Dialo
- Page 1372 and 1373:
ATC Dialog Options: Common Options
- Page 1374 and 1375:
Contingency elements have an associ
- Page 1376 and 1377:
ATC Dialog Common Options: Transfer
- Page 1378 and 1379:
Line D contains transfer limiter fo
- Page 1380 and 1381:
Linearize Makeup Power Calculation
- Page 1382 and 1383:
Because the goal is to stress the s
- Page 1384 and 1385:
ATC Extra Monitors Dialog Simulator
- Page 1386 and 1387:
ATC Dialog: Result The Result page
- Page 1388 and 1389:
Note: This does not immediately abo
- Page 1390 and 1391:
See Scenarios page for more informa
- Page 1392 and 1393:
Multiple Scenario ATC Dialog: Scena
- Page 1394 and 1395:
injection change exceeds a certain
- Page 1396 and 1397:
One axis has heading labels G0, G1,
- Page 1398 and 1399:
Multiple Scenario ATC Dialog: Combi
- Page 1400 and 1401:
The Branch Limiters tab only shows
- Page 1402 and 1403:
This is the OTDF (or PTDF if the Li
- Page 1404 and 1405:
ATC Analysis Methods: Single Linear
- Page 1406 and 1407:
stepsize so as much as possible of
- Page 1408 and 1409:
ATC Analysis Methods: Iterated Line
- Page 1410 and 1411:
o This step removes the contingency
- Page 1412 and 1413:
Simulator Automation Server (SimAut
- Page 1414 and 1415:
Including Simulator Automation Serv
- Page 1416 and 1417:
Microsoft Visual C++ Declare a var
- Page 1418 and 1419:
Getting Data from the Simulator Aut
- Page 1420 and 1421:
ChangeParameters Function The Chang
- Page 1422 and 1423:
ChangeParametersSingleElement Sampl
- Page 1424 and 1425:
ChangeParametersMultipleElement Fun
- Page 1426 and 1427:
Output = SimAuto.ChangeParametersMu
- Page 1428 and 1429:
ChangeParametersMultipleElementFlat
- Page 1430 and 1431:
CloseCase Function The CloseCase fu
- Page 1432 and 1433:
GetFieldList Function The GetFieldL
- Page 1434 and 1435:
GetParametersSingleElement Function
- Page 1436 and 1437:
GetParametersSingleElement Function
- Page 1438 and 1439:
GetParametersSingleElement Function
- Page 1440 and 1441:
GetParametersSingleElement Function
- Page 1442 and 1443:
GetParametersMultipleElement Functi
- Page 1444 and 1445:
GetParametersMultipleElement Sample
- Page 1446 and 1447:
disp(fieldarray) disp(busesparam) e
- Page 1448 and 1449:
Dim lowobj, highobj As Integer lowo
- Page 1450 and 1451:
GetParameters Function This functio
- Page 1452 and 1453:
As you can see, to access the first
- Page 1454 and 1455:
end; end; end; ©2011 PowerWorld Co
- Page 1456 and 1457:
num2str(devicelist2(counter)) ' ' .
- Page 1458 and 1459:
DisplayMessage "Number of Key Field
- Page 1460 and 1461:
ListOfDevicesFlatOutput Function Th
- Page 1462 and 1463:
LoadState Function: Sample Code Mic
- Page 1464 and 1465:
OpenCase Function: Sample Code Borl
- Page 1466 and 1467:
ProcessAuxFile Function: Sample Cod
- Page 1468 and 1469:
RunScriptCommand Function: Sample C
- Page 1470 and 1471:
SaveCase Function: Sample Code Micr
- Page 1472 and 1473:
SaveState Function: Sample Code Mic
- Page 1474 and 1475:
SendToExcel Function: Sample Code M
- Page 1476 and 1477:
©2011 PowerWorld Corporation 1448
- Page 1478 and 1479:
©2011 PowerWorld Corporation 1450
- Page 1480 and 1481:
%Delete (close) the COM object. del
- Page 1482 and 1483:
WriteAuxFile Function: Sample Code
- Page 1484 and 1485:
Simulator Automation Server Propert
- Page 1486 and 1487:
ExcelApp Property: Sample Code Micr
- Page 1488 and 1489:
CurrentDir Property: Sample Code Mi
- Page 1490 and 1491:
ProcessID Property: Sample Code Mic
- Page 1492 and 1493:
PowerWorld Object Variables The abi
- Page 1494 and 1495:
Installing Simulator Automation Ser
- Page 1496 and 1497:
Connecting to Simulator Automation
- Page 1498 and 1499:
Simulator Automation Server Propert
- Page 1500 and 1501:
Simulator Automation Server Functio
- Page 1502 and 1503:
CloseCase Function (version 9) The
- Page 1504 and 1505:
ListOfDevices Function (version 9)
- Page 1506 and 1507:
OpenCase Function (version 9) The O
- Page 1508 and 1509:
RunScriptCommand Function (version
- Page 1510 and 1511:
SendToExcel Function (version 9) Th
- Page 1512 and 1513:
PowerWorld Object Variables (Versio
- Page 1514 and 1515:
Integrated Topology Processing Over
- Page 1516 and 1517:
Integrated Topology Processing: Ful
- Page 1518 and 1519:
Integrated Topology Processing: Sup
- Page 1520 and 1521:
Integrated Topology Processing: Con
- Page 1522 and 1523:
Integrated Topology Processing Cons
- Page 1524 and 1525:
Integrated Topology Processing: Con
- Page 1526 and 1527:
Integrated Topology Processing Dial
- Page 1528 and 1529:
Integrated Topology Processing: Pow
- Page 1530 and 1531:
Integrated Topology Processing: Con
- Page 1532 and 1533:
Contingency Element: Open Breakers
- Page 1534 and 1535:
Integrated Topology Processing: Inc
- Page 1536 and 1537:
Integrated Topology Processing: Sav
- Page 1538 and 1539:
Integrated Topology Processing: Sav
- Page 1540 and 1541:
Provides the mapping used when solv
- Page 1542 and 1543:
Device Derived Status Differences e
- Page 1544 and 1545:
In this last example, additional br
- Page 1546 and 1547:
Transient Stability Overview The Tr
- Page 1548 and 1549:
Governor Response Limits There is a
- Page 1550 and 1551:
©2011 PowerWorld Corporation 1522
- Page 1552 and 1553:
The WT1G model is the GE DYD repres
- Page 1554 and 1555:
Transient Stability Overview: Loads
- Page 1556 and 1557:
Transient Contour Toolbar The Trans
- Page 1558 and 1559:
Transient Stability Numerical Integ
- Page 1560 and 1561:
Transient Stability Overview: PlayI
- Page 1562 and 1563:
Transient Stability: Model Data Man
- Page 1564 and 1565:
When clicking this button, the Bloc
- Page 1566 and 1567:
Transient Stability Case Info Menu
- Page 1568 and 1569:
Choose the appropriate option to sa
- Page 1570 and 1571:
All On the listing which shows all
- Page 1572 and 1573:
Transient Stability Data: Block Dia
- Page 1574 and 1575:
model suite. The CAPRELAY model can
- Page 1576 and 1577:
Transient Limit Monitors States/Man
- Page 1578 and 1579:
Transient Stability Analysis: Simul
- Page 1580 and 1581:
Transient Stability Contingency Ele
- Page 1582 and 1583:
OK Fault Type - Balanced 3 Phase, S
- Page 1584 and 1585:
Transient Stability Analysis Option
- Page 1586 and 1587:
When this option is checked, an est
- Page 1588 and 1589:
higher than nominal frequency, then
- Page 1590 and 1591:
Transient Stability Dialog Options:
- Page 1592 and 1593:
Transient Stability Dialog Options:
- Page 1594 and 1595:
©2011 PowerWorld Corporation 1566
- Page 1596 and 1597:
Set All NO Click the Set All NO but
- Page 1598 and 1599:
Make Plot This button is enabled wh
- Page 1600 and 1601:
A list of objects types for which t
- Page 1602 and 1603:
A more complicated example consisti
- Page 1604 and 1605:
©2011 PowerWorld Corporation 1576
- Page 1606 and 1607:
Click the Add Plot button found on
- Page 1608 and 1609:
Axis group selected - axis groups w
- Page 1610 and 1611:
Transient Stability Analysis Plot D
- Page 1612 and 1613:
Transient Stability Analysis Plot D
- Page 1614 and 1615:
Transient Stability Analysis Plot D
- Page 1616 and 1617:
Transient Stability Analysis Plot D
- Page 1618 and 1619:
Transient Stability Analysis Plot D
- Page 1620 and 1621:
Transient Stability Analysis Plot D
- Page 1622 and 1623:
Solid, Dashed, Dot, Dash Dot, and D
- Page 1624 and 1625:
Provides access to export images, b
- Page 1626 and 1627:
Transient Stability : Defining Tran
- Page 1628 and 1629:
toolbar and then choosing the appro
- Page 1630 and 1631:
value occurs. Note that point B may
- Page 1632 and 1633:
Analysis time at which the maximum
- Page 1634 and 1635:
Transient Stability Analysis: State
- Page 1636 and 1637:
Transient Stability Analysis: Valid
- Page 1638 and 1639:
if Xl > Xqpp then Xl = 0.8*Xqpp if
- Page 1640 and 1641:
In addition to getting the eigenval
- Page 1642 and 1643:
plot will be drawn. When creating a
- Page 1644 and 1645:
Distributed Computing Add-Ons The D
- Page 1646 and 1647:
Tutorial: Creating a New Case Page
- Page 1648 and 1649:
The Bus Number field automatically
- Page 1650 and 1651:
Click OK on the Generator Option Di
- Page 1652 and 1653:
Tutorial: Entering a Second Bus wit
- Page 1654 and 1655:
©2011 PowerWorld Corporation 1626
- Page 1656 and 1657:
The Series Resistance, Series React
- Page 1658 and 1659:
©2011 PowerWorld Corporation 1630
- Page 1660 and 1661:
©2011 PowerWorld Corporation 1632
- Page 1662 and 1663:
atio of nominal voltages between th
- Page 1664 and 1665:
Tutorial: Inserting a Switched Shun
- Page 1666 and 1667:
Tutorial: Inserting Text, Bus and L
- Page 1668 and 1669:
The parameter and position are disp
- Page 1670 and 1671:
Tutorial: Solving the Case Page 12
- Page 1672 and 1673:
Tutorial: Adding a New Area Page 13
- Page 1674 and 1675:
Change the Area Name to ‘One’ a
- Page 1676 and 1677:
Tutorial: Loading an Existing Power
- Page 1678 and 1679:
Tutorial: Solving the Case Page 4 o
- Page 1680 and 1681:
Tutorial: Entering a Bus Page 6 of
- Page 1682 and 1683:
Panning and Zooming Page 8 of 15 Tw
- Page 1684 and 1685:
Tutorial: Simulating the Case Page
- Page 1686 and 1687:
Oneline Local Menu Page 12 of 15 Se
- Page 1688 and 1689:
Limit Violations Page 14 of 15 You
- Page 1690 and 1691:
Tutorial: Solving an OPF Page 1 of
- Page 1692 and 1693:
Tutorial: OPF Line Limit Enforcemen
- Page 1694 and 1695:
Tutorial: OPF Marginal Cost of Enfo
- Page 1696 and 1697:
B3LP Solved with Unenforceable Cons
- Page 1698 and 1699:
Area Buses, 428 Area Gens, 429 Area
- Page 1700 and 1701:
ChangeParametersMultipleElement Sam
- Page 1702 and 1703:
DC Transmission Line Options, 350 D
- Page 1704 and 1705:
General, 489, 622, 654 General Scri
- Page 1706 and 1707:
Jacobian, 97, 284 Key Field, 664 Ke
- Page 1708 and 1709:
Mouse Wheel Zooming, 828 Movie Make
- Page 1710 and 1711:
Palettes, 776, 777 ©2011 PowerWorl
- Page 1712 and 1713:
Quick Access Toolbar, 29 Tools, 57
- Page 1714 and 1715:
Sensitivities, 986, 991, 996, 997,
- Page 1716 and 1717:
Schedule Subscription Dialog, 1152
- Page 1718:
X Grid Spacing, 798 XF, 255 x-y, 87
Inappropriate
Loading...
Inappropriate
You have already flagged this document.
Thank you, for helping us keep this platform clean.
The editors will have a look at it as soon as possible.
Mail this publication
Loading...
Embed
Loading...
Delete template?
Are you sure you want to delete your template?
DOWNLOAD ePAPER
This ePaper is currently not available for download.
You can find similar magazines on this topic below under ‘Recommendations’.
