

STATA 11 for Windows SAMPLE SESSION - Food Security Group ...
STATA 11 for Windows SAMPLE SESSION - Food Security Group ...
STATA 11 for Windows SAMPLE SESSION - Food Security Group ...

Create successful ePaper yourself
Turn your PDF publications into a flip-book with our unique Google optimized e-Paper software.
Stata <strong>11</strong> Sample Session Section 4 – Tables and Graphs, Survey estimation<br />
Stata <strong>11</strong> <strong>SAMPLE</strong> <strong>SESSION</strong><br />
SECTION 4 - Table and Graphs - how to bring them into a word processor, and survey<br />
estimation, accounting <strong>for</strong> design effects<br />
How to move Stata results<br />
into other applications<br />
Tables<br />
-------------------------------------------------------------------------------------<br />
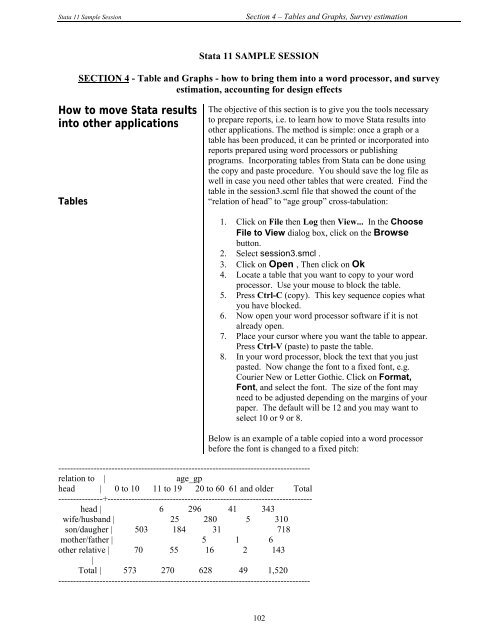
relation to | age_gp<br />
head | 0 to 10 <strong>11</strong> to 19 20 to 60 61 and older Total<br />
---------------+---------------------------------------------------------------------<br />
head | 6 296 41 343<br />
wife/husband | 25 280 5 310<br />
son/daugher | 503 184 31 718<br />
mother/father | 5 1 6<br />
other relative | 70 55 16 2 143<br />
|<br />
Total | 573 270 628 49 1,520<br />
-------------------------------------------------------------------------------------<br />
The objective of this section is to give you the tools necessary<br />
to prepare reports, i.e. to learn how to move Stata results into<br />
other applications. The method is simple: once a graph or a<br />
table has been produced, it can be printed or incorporated into<br />
reports prepared using word processors or publishing<br />
programs. Incorporating tables from Stata can be done using<br />
the copy and paste procedure. You should save the log file as<br />
well in case you need other tables that were created. Find the<br />
table in the session3.scml file that showed the count of the<br />
“relation of head” to “age group” cross-tabulation:<br />
1. Click on File then Log then View... In the Choose<br />
File to View dialog box, click on the Browse<br />
button.<br />
2. Select session3.smcl .<br />
3. Click on Open , Then click on Ok<br />
4. Locate a table that you want to copy to your word<br />
processor. Use your mouse to block the table.<br />
5. Press Ctrl-C (copy). This key sequence copies what<br />
you have blocked.<br />
6. Now open your word processor software if it is not<br />
already open.<br />
7. Place your cursor where you want the table to appear.<br />
Press Ctrl-V (paste) to paste the table.<br />
8. In your word processor, block the text that you just<br />
pasted. Now change the font to a fixed font, e.g.<br />
Courier New or Letter Gothic. Click on Format,<br />
Font, and select the font. The size of the font may<br />
need to be adjusted depending on the margins of your<br />
paper. The default will be 12 and you may want to<br />
select 10 or 9 or 8.<br />
Below is an example of a table copied into a word processor<br />
be<strong>for</strong>e the font is changed to a fixed pitch:<br />
102


