

STATA 11 for Windows SAMPLE SESSION - Food Security Group ...
STATA 11 for Windows SAMPLE SESSION - Food Security Group ...
STATA 11 for Windows SAMPLE SESSION - Food Security Group ...

You also want an ePaper? Increase the reach of your titles
YUMPU automatically turns print PDFs into web optimized ePapers that Google loves.
Stata <strong>11</strong> Sample Session Section 3 – Tables and other Types of Analysis<br />
1. Click on File then Open<br />
2. Select hh-file3.dta, Click on Open<br />
3. Copy the command and paste it into the do-file<br />
editor<br />
First we will use the summarize command:<br />
1. From the Statistics menu select Summaries, tables<br />
& tests then Summary and descriptive statistics<br />
then Summary statistics<br />
The summarize - Summary statistics dialog box opens.<br />
2. Select cprod_ae in the “variables” box.<br />
3. Be sure that under “Options” in this tab, Standard<br />
Display has been selected.<br />
4. Click on the “by/if/in” tab.<br />
5. Click in the box “Repeat command <strong>for</strong> groups defined<br />
by”<br />
6. In the box below this option, select district quart<br />
7. Click on the copy button, switch to the do-file editor,<br />
paste the command, switch back to the dialog box<br />
and click on Ok.<br />
For each combination of district and quart, we see the summary<br />
statistics. This output is difficult to read.<br />
Next we will use the tabulate command:<br />
1. From the menus click on Statistics then Summaries,<br />
tables & tests then Tables then One/two-way table<br />
of summary statistics<br />
The tabsum - One/two-way table of summary statistics<br />
dialog box opens.<br />
2. In the Variable 1: box select district<br />
3. In the Variable 2 (optional): box select quart.<br />
4. In the Summarize Variable: box select cprod_ae.<br />
5. For output we are only interested in the mean, so tick the<br />
boxes next to<br />
✓ Suppress standard deviation<br />
✓ Suppress frequencies<br />
✓ Suppress number of observations<br />
5. Click on the copy button, switch to the do-file<br />
editor, paste the command, switch back to the<br />
dialog box and click on Ok.<br />
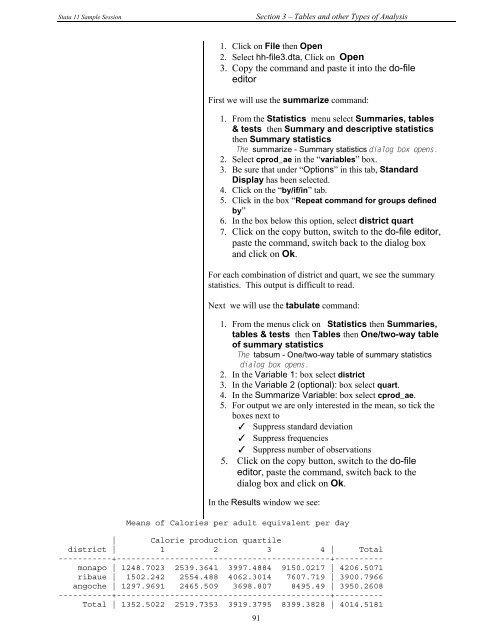
In the Results window we see:<br />
Means of Calories per adult equivalent per day<br />
| Calorie production quartile<br />
district | 1 2 3 4 | Total<br />
-----------+--------------------------------------------+----------<br />
monapo | 1248.7023 2539.3641 3997.4884 9150.0217 | 4206.5071<br />
ribaue | 1502.242 2554.488 4062.3014 7607.719 | 3900.7966<br />
angoche | 1297.9691 2465.509 3698.807 8495.49 | 3950.2608<br />
-----------+--------------------------------------------+----------<br />
Total | 1352.5022 2519.7353 3919.3795 8399.3828 | 4014.5181<br />
91


