

STATA 11 for Windows SAMPLE SESSION - Food Security Group ...
STATA 11 for Windows SAMPLE SESSION - Food Security Group ...
STATA 11 for Windows SAMPLE SESSION - Food Security Group ...

You also want an ePaper? Increase the reach of your titles
YUMPU automatically turns print PDFs into web optimized ePapers that Google loves.
Stata <strong>11</strong> Sample Session Section 3 – Tables and other Types of Analysis<br />
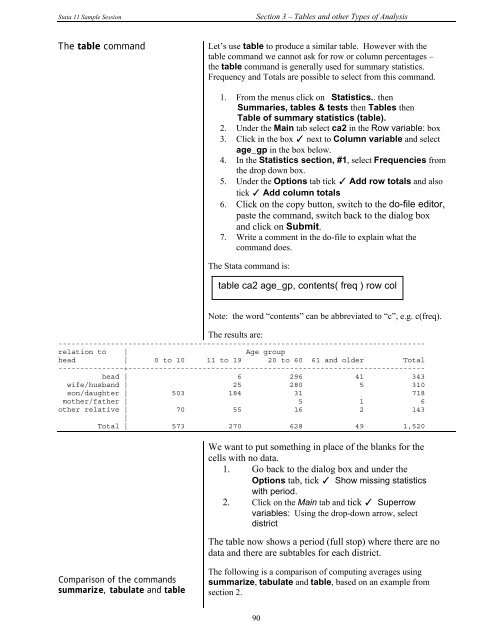
The table command Let’s use table to produce a similar table. However with the<br />
table command we cannot ask <strong>for</strong> row or column percentages –<br />
the table command is generally used <strong>for</strong> summary statistics.<br />
Frequency and Totals are possible to select from this command.<br />
1. From the menus click on Statistics.. then<br />
Summaries, tables & tests then Tables then<br />
Table of summary statistics (table).<br />
2. Under the Main tab select ca2 in the Row variable: box<br />
3. Click in the box ✓ next to Column variable and select<br />
age_gp in the box below.<br />
4. In the Statistics section, #1, select Frequencies from<br />
the drop down box.<br />
5. Under the Options tab tick ✓ Add row totals and also<br />
tick ✓ Add column totals<br />
6. Click on the copy button, switch to the do-file editor,<br />
paste the command, switch back to the dialog box<br />
and click on Submit.<br />
7. Write a comment in the do-file to explain what the<br />
command does.<br />
The Stata command is:<br />
Note: the word “contents” can be abbreviated to “c”, e.g. c(freq).<br />
The results are:<br />
------------------------------------------------------------------------------------<br />
relation to | Age group<br />
head | 0 to 10 <strong>11</strong> to 19 20 to 60 61 and older Total<br />
---------------+--------------------------------------------------------------------<br />
head | 6 296 41 343<br />
wife/husband | 25 280 5 310<br />
son/daughter | 503 184 31 718<br />
mother/father | 5 1 6<br />
other relative | 70 55 16 2 143<br />
|<br />
Total | 573 270 628 49 1,520<br />
Comparison of the commands<br />
summarize, tabulate and table<br />
table ca2 age_gp, contents( freq ) row col<br />
We want to put something in place of the blanks <strong>for</strong> the<br />
cells with no data.<br />
1. Go back to the dialog box and under the<br />
Options tab, tick ✓ Show missing statistics<br />
with period.<br />
2. Click on the Main tab and tick ✓ Superrow<br />
variables: Using the drop-down arrow, select<br />
district<br />
The table now shows a period (full stop) where there are no<br />
data and there are subtables <strong>for</strong> each district.<br />
The following is a comparison of computing averages using<br />
summarize, tabulate and table, based on an example from<br />
section 2.<br />
90


