

STATA 11 for Windows SAMPLE SESSION - Food Security Group ...
STATA 11 for Windows SAMPLE SESSION - Food Security Group ...
STATA 11 for Windows SAMPLE SESSION - Food Security Group ...

You also want an ePaper? Increase the reach of your titles
YUMPU automatically turns print PDFs into web optimized ePapers that Google loves.
Stata <strong>11</strong> Sample Session Section 4 – Tables and Graphs, Survey estimation<br />
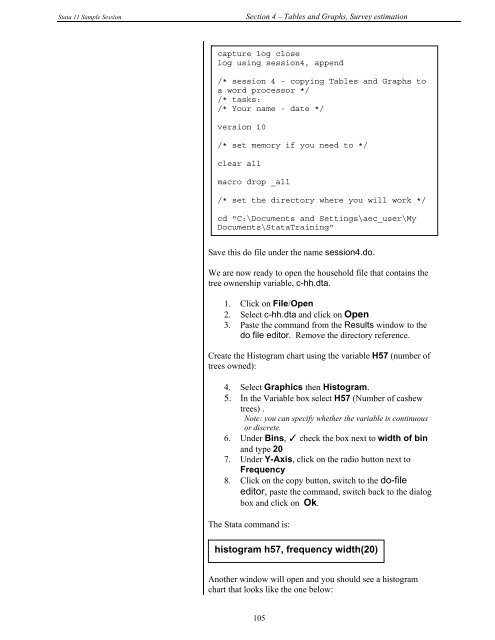
capture log close<br />
log using session4, append<br />
/* session 4 - copying Tables and Graphs to<br />
a word processor */<br />
/* tasks:<br />
/* Your name - date */<br />
version 10<br />
/* set memory if you need to */<br />
clear all<br />
macro drop _all<br />
/* set the directory where you will work */<br />
cd "C:\Documents and Settings\aec_user\My<br />
Documents\StataTraining"<br />
Save this do file under the name session4.do.<br />
We are now ready to open the household file that contains the<br />
tree ownership variable, c-hh.dta.<br />
1. Click on File/Open<br />
2. Select c-hh.dta and click on Open<br />
3. Paste the command from the Results window to the<br />
do file editor. Remove the directory reference.<br />
Create the Histogram chart using the variable H57 (number of<br />
trees owned):<br />
4. Select Graphics then Histogram.<br />
5. In the Variable box select H57 (Number of cashew<br />
trees) .<br />
Note: you can specify whether the variable is continuous<br />
or discrete.<br />
6. Under Bins, ✓ check the box next to width of bin<br />
and type 20<br />
7. Under Y-Axis, click on the radio button next to<br />
Frequency<br />
8. Click on the copy button, switch to the do-file<br />
editor, paste the command, switch back to the dialog<br />
box and click on Ok.<br />
The Stata command is:<br />
histogram h57, frequency width(20)<br />
Another window will open and you should see a histogram<br />
chart that looks like the one below:<br />
105


