

STATA 11 for Windows SAMPLE SESSION - Food Security Group ...
STATA 11 for Windows SAMPLE SESSION - Food Security Group ...
STATA 11 for Windows SAMPLE SESSION - Food Security Group ...

You also want an ePaper? Increase the reach of your titles
YUMPU automatically turns print PDFs into web optimized ePapers that Google loves.
Stata <strong>11</strong> Sample Session Section 1 - Basic functions: Files, Descriptives, Data Trans<strong>for</strong>mations<br />
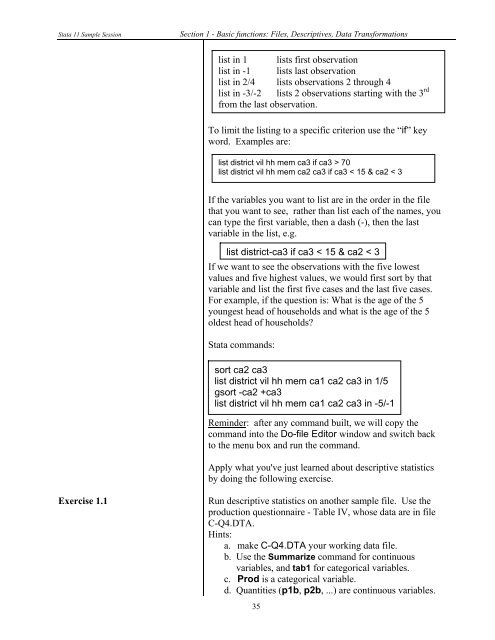
list in 1 lists first observation<br />
list in -1 lists last observation<br />
list in 2/4 lists observations 2 through 4<br />
list in -3/-2 lists 2 observations starting with the 3 rd<br />
from the last observation.<br />
To limit the listing to a specific criterion use the “if” key<br />
word. Examples are:<br />
list district vil hh mem ca3 if ca3 > 70<br />
list district vil hh mem ca2 ca3 if ca3 < 15 & ca2 < 3<br />
If the variables you want to list are in the order in the file<br />
that you want to see, rather than list each of the names, you<br />
can type the first variable, then a dash (-), then the last<br />
variable in the list, e.g.<br />
list district-ca3 if ca3 < 15 & ca2 < 3<br />
If we want to see the observations with the five lowest<br />
values and five highest values, we would first sort by that<br />
variable and list the first five cases and the last five cases.<br />
For example, if the question is: What is the age of the 5<br />
youngest head of households and what is the age of the 5<br />
oldest head of households?<br />
Stata commands:<br />
sort ca2 ca3<br />
list district vil hh mem ca1 ca2 ca3 in 1/5<br />
gsort -ca2 +ca3<br />
list district vil hh mem ca1 ca2 ca3 in -5/-1<br />
Reminder: after any command built, we will copy the<br />
command into the Do-file Editor window and switch back<br />
to the menu box and run the command.<br />
Apply what you've just learned about descriptive statistics<br />
by doing the following exercise.<br />
Exercise 1.1 Run descriptive statistics on another sample file. Use the<br />
production questionnaire - Table IV, whose data are in file<br />
C-Q4.DTA.<br />
Hints:<br />
a. make C-Q4.DTA your working data file.<br />
b. Use the Summarize command <strong>for</strong> continuous<br />
variables, and tab1 <strong>for</strong> categorical variables.<br />
c. Prod is a categorical variable.<br />
d. Quantities (p1b, p2b, ...) are continuous variables.<br />
35


