

STATA 11 for Windows SAMPLE SESSION - Food Security Group ...
STATA 11 for Windows SAMPLE SESSION - Food Security Group ...
STATA 11 for Windows SAMPLE SESSION - Food Security Group ...

Create successful ePaper yourself
Turn your PDF publications into a flip-book with our unique Google optimized e-Paper software.
Stata <strong>11</strong> Sample Session Section 2 – Restructuring Data Files – Table Lookup & Aggregation<br />
<strong>STATA</strong> <strong>11</strong> - <strong>SAMPLE</strong> <strong>SESSION</strong><br />
SECTION 2 - Restructuring Data Files - Table Lookup & Aggregation<br />
Restructuring Data Files For some types of analysis the data files may need to be<br />
restructured to a different level. The data from the four<br />
sections of the questionnaires—household, member,<br />
production and sales—are in four separate data files<br />
because the data are at different levels. The household<br />
data is at the most general, or highest, level - one case per<br />
household. The other three files contain more detailed<br />
data, which is usually thought of as being at a lower level<br />
- there are multiple cases per household. If you are not<br />
familiar with the concept of levels of data, read<br />
"Computer Analysis of Survey Data -- File Organization<br />
<strong>for</strong> Multi-Level Data" by Chris Wolf, be<strong>for</strong>e continuing<br />
on with this section. This paper is available at<br />
http://www.aec.msu.edu/fs2/survey/index.htm<br />
The analysis we did in Section 1 was done at each level<br />
separately, using just the variables in a single file at a<br />
time. However, other types of analysis require<br />
combining data from more than one file. Let's look at an<br />
example.<br />
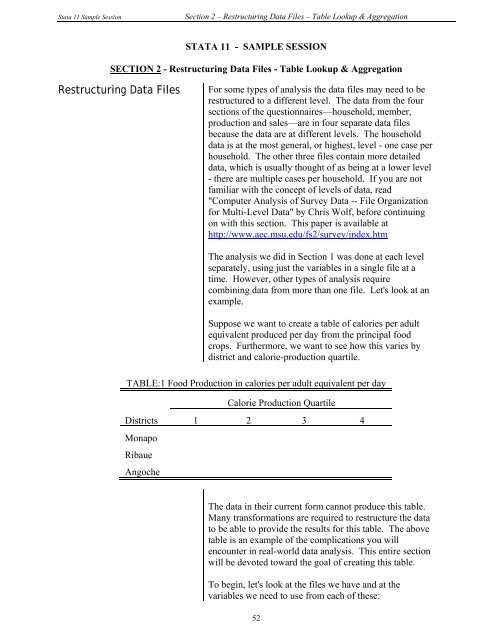
Suppose we want to create a table of calories per adult<br />
equivalent produced per day from the principal food<br />
crops. Furthermore, we want to see how this varies by<br />
district and calorie-production quartile.<br />
TABLE:1 <strong>Food</strong> Production in calories per adult equivalent per day<br />
Calorie Production Quartile<br />
Districts 1 2 3 4<br />
Monapo<br />
Ribaue<br />
Angoche<br />
The data in their current <strong>for</strong>m cannot produce this table.<br />
Many trans<strong>for</strong>mations are required to restructure the data<br />
to be able to provide the results <strong>for</strong> this table. The above<br />
table is an example of the complications you will<br />
encounter in real-world data analysis. This entire section<br />
will be devoted toward the goal of creating this table.<br />
To begin, let's look at the files we have and at the<br />
variables we need to use from each of these:<br />
52


