

STATA 11 for Windows SAMPLE SESSION - Food Security Group ...
STATA 11 for Windows SAMPLE SESSION - Food Security Group ...
STATA 11 for Windows SAMPLE SESSION - Food Security Group ...

You also want an ePaper? Increase the reach of your titles
YUMPU automatically turns print PDFs into web optimized ePapers that Google loves.
Stata <strong>11</strong> Sample Session Section 2 – Restructuring Data Files – Table Lookup & Aggregation<br />
Replace “missing values” with a<br />
mean value<br />
4. Click on the copy button, switch to the do-file<br />
editor, paste the command, switch back to the<br />
dialog box and click on the Ok button.<br />
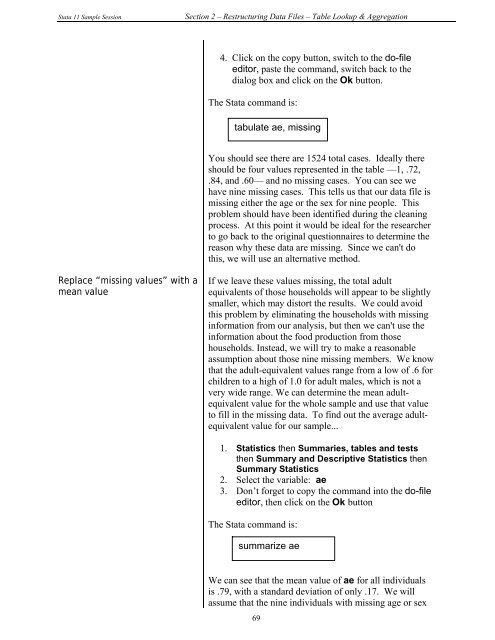
The Stata command is:<br />
tabulate ae, missing<br />
You should see there are 1524 total cases. Ideally there<br />
should be four values represented in the table —1, .72,<br />
.84, and .60— and no missing cases. You can see we<br />
have nine missing cases. This tells us that our data file is<br />
missing either the age or the sex <strong>for</strong> nine people. This<br />
problem should have been identified during the cleaning<br />
process. At this point it would be ideal <strong>for</strong> the researcher<br />
to go back to the original questionnaires to determine the<br />
reason why these data are missing. Since we can't do<br />
this, we will use an alternative method.<br />
If we leave these values missing, the total adult<br />
equivalents of those households will appear to be slightly<br />
smaller, which may distort the results. We could avoid<br />
this problem by eliminating the households with missing<br />
in<strong>for</strong>mation from our analysis, but then we can't use the<br />
in<strong>for</strong>mation about the food production from those<br />
households. Instead, we will try to make a reasonable<br />
assumption about those nine missing members. We know<br />
that the adult-equivalent values range from a low of .6 <strong>for</strong><br />
children to a high of 1.0 <strong>for</strong> adult males, which is not a<br />
very wide range. We can determine the mean adultequivalent<br />
value <strong>for</strong> the whole sample and use that value<br />
to fill in the missing data. To find out the average adultequivalent<br />
value <strong>for</strong> our sample...<br />
1. Statistics then Summaries, tables and tests<br />
then Summary and Descriptive Statistics then<br />
Summary Statistics<br />
2. Select the variable: ae<br />
3. Don’t <strong>for</strong>get to copy the command into the do-file<br />
editor, then click on the Ok button<br />
The Stata command is:<br />
summarize ae<br />
We can see that the mean value of ae <strong>for</strong> all individuals<br />
is .79, with a standard deviation of only .17. We will<br />
assume that the nine individuals with missing age or sex<br />
69


