STATA 11 for Windows SAMPLE SESSION - Food Security Group ...
STATA 11 for Windows SAMPLE SESSION - Food Security Group ...
STATA 11 for Windows SAMPLE SESSION - Food Security Group ...
Create successful ePaper yourself
Turn your PDF publications into a flip-book with our unique Google optimized e-Paper software.
Stata <strong>11</strong> Sample Session Section 2 – Restructuring Data Files – Table Lookup & Aggregation<br />
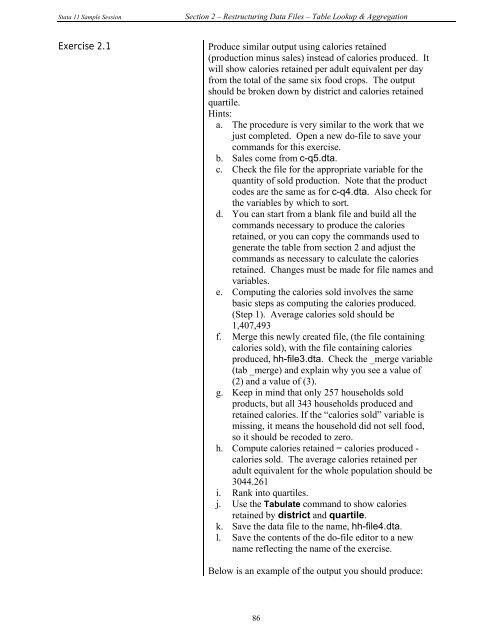
Exercise 2.1 Produce similar output using calories retained<br />
(production minus sales) instead of calories produced. It<br />
will show calories retained per adult equivalent per day<br />
from the total of the same six food crops. The output<br />
should be broken down by district and calories retained<br />
quartile.<br />
Hints:<br />
a. The procedure is very similar to the work that we<br />
just completed. Open a new do-file to save your<br />
commands <strong>for</strong> this exercise.<br />
b. Sales come from c-q5.dta.<br />
c. Check the file <strong>for</strong> the appropriate variable <strong>for</strong> the<br />
quantity of sold production. Note that the product<br />
codes are the same as <strong>for</strong> c-q4.dta. Also check <strong>for</strong><br />
the variables by which to sort.<br />
d. You can start from a blank file and build all the<br />
commands necessary to produce the calories<br />
retained, or you can copy the commands used to<br />
generate the table from section 2 and adjust the<br />
commands as necessary to calculate the calories<br />
retained. Changes must be made <strong>for</strong> file names and<br />
variables.<br />
e. Computing the calories sold involves the same<br />
basic steps as computing the calories produced.<br />
(Step 1). Average calories sold should be<br />
1,407,493<br />
f. Merge this newly created file, (the file containing<br />
calories sold), with the file containing calories<br />
produced, hh-file3.dta. Check the _merge variable<br />
(tab _merge) and explain why you see a value of<br />
(2) and a value of (3).<br />
g. Keep in mind that only 257 households sold<br />
products, but all 343 households produced and<br />
retained calories. If the “calories sold” variable is<br />
missing, it means the household did not sell food,<br />
so it should be recoded to zero.<br />
h. Compute calories retained = calories produced -<br />
calories sold. The average calories retained per<br />
adult equivalent <strong>for</strong> the whole population should be<br />
3044.261<br />
i. Rank into quartiles.<br />
j. Use the Tabulate command to show calories<br />
retained by district and quartile.<br />
k. Save the data file to the name, hh-file4.dta.<br />
l. Save the contents of the do-file editor to a new<br />
name reflecting the name of the exercise.<br />
Below is an example of the output you should produce:<br />
86


