STATA 11 for Windows SAMPLE SESSION - Food Security Group ...
STATA 11 for Windows SAMPLE SESSION - Food Security Group ...
STATA 11 for Windows SAMPLE SESSION - Food Security Group ...
Create successful ePaper yourself
Turn your PDF publications into a flip-book with our unique Google optimized e-Paper software.
Stata <strong>11</strong> Sample Session Section 1 - Basic functions: Files, Descriptives, Data Trans<strong>for</strong>mations<br />
categorical variable. This type of variable denotes<br />
Indicator variable<br />
whether something is true, e.g. yes/no questions, or<br />
whether a person is male or female. This type of<br />
variable contains only 2 categories, i.e., it divides<br />
the data into 2 groups.<br />
Descriptive statististics -<br />
using one variable<br />
Descriptives<br />
The summarize command<br />
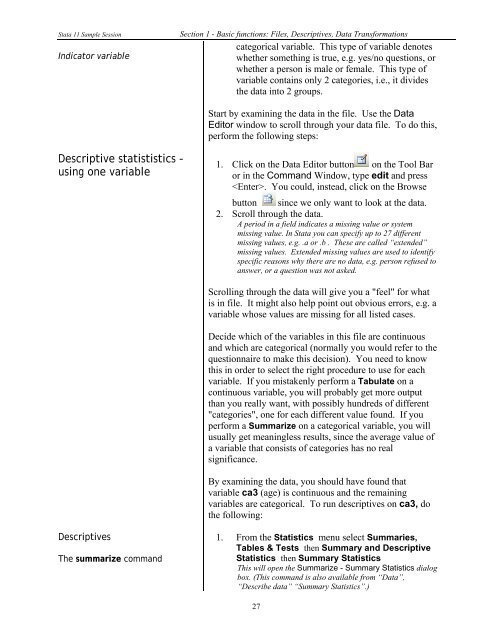
Start by examining the data in the file. Use the Data<br />
Editor window to scroll through your data file. To do this,<br />
per<strong>for</strong>m the following steps:<br />
1. Click on the Data Editor button on the Tool Bar<br />
or in the Command Window, type edit and press<br />
. You could, instead, click on the Browse<br />
button since we only want to look at the data.<br />
2. Scroll through the data.<br />
A period in a field indicates a missing value or system<br />
missing value. In Stata you can specify up to 27 different<br />
missing values, e.g. .a or .b . These are called “extended”<br />
missing values. Extended missing values are used to identify<br />
specific reasons why there are no data, e.g. person refused to<br />
answer, or a question was not asked.<br />
Scrolling through the data will give you a "feel" <strong>for</strong> what<br />
is in file. It might also help point out obvious errors, e.g. a<br />
variable whose values are missing <strong>for</strong> all listed cases.<br />
Decide which of the variables in this file are continuous<br />
and which are categorical (normally you would refer to the<br />
questionnaire to make this decision). You need to know<br />
this in order to select the right procedure to use <strong>for</strong> each<br />
variable. If you mistakenly per<strong>for</strong>m a Tabulate on a<br />
continuous variable, you will probably get more output<br />
than you really want, with possibly hundreds of different<br />
"categories", one <strong>for</strong> each different value found. If you<br />
per<strong>for</strong>m a Summarize on a categorical variable, you will<br />
usually get meaningless results, since the average value of<br />
a variable that consists of categories has no real<br />
significance.<br />
By examining the data, you should have found that<br />
variable ca3 (age) is continuous and the remaining<br />
variables are categorical. To run descriptives on ca3, do<br />
the following:<br />
1. From the Statistics menu select Summaries,<br />
Tables & Tests then Summary and Descriptive<br />
Statistics then Summary Statistics<br />
This will open the Summarize - Summary Statistics dialog<br />
box. (This command is also available from “Data”,<br />
“Describe data” “Summary Statistics”.)<br />
27


