STATA 11 for Windows SAMPLE SESSION - Food Security Group ...
STATA 11 for Windows SAMPLE SESSION - Food Security Group ...
STATA 11 for Windows SAMPLE SESSION - Food Security Group ...
You also want an ePaper? Increase the reach of your titles
YUMPU automatically turns print PDFs into web optimized ePapers that Google loves.
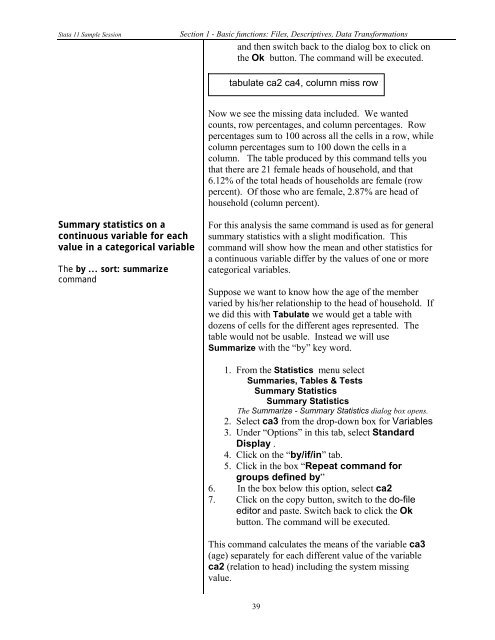
Stata <strong>11</strong> Sample Session Section 1 - Basic functions: Files, Descriptives, Data Trans<strong>for</strong>mations<br />
and then switch back to the dialog box to click on<br />
the Ok button. The command will be executed.<br />
Summary statistics on a<br />
continuous variable <strong>for</strong> each<br />
value in a categorical variable<br />
The by ... sort: summarize<br />
command<br />
tabulate ca2 ca4, column miss row<br />
Now we see the missing data included. We wanted<br />
counts, row percentages, and column percentages. Row<br />
percentages sum to 100 across all the cells in a row, while<br />
column percentages sum to 100 down the cells in a<br />
column. The table produced by this command tells you<br />
that there are 21 female heads of household, and that<br />
6.12% of the total heads of households are female (row<br />
percent). Of those who are female, 2.87% are head of<br />
household (column percent).<br />
For this analysis the same command is used as <strong>for</strong> general<br />
summary statistics with a slight modification. This<br />
command will show how the mean and other statistics <strong>for</strong><br />
a continuous variable differ by the values of one or more<br />
categorical variables.<br />
Suppose we want to know how the age of the member<br />
varied by his/her relationship to the head of household. If<br />
we did this with Tabulate we would get a table with<br />
dozens of cells <strong>for</strong> the different ages represented. The<br />
table would not be usable. Instead we will use<br />
Summarize with the “by” key word.<br />
1. From the Statistics menu select<br />
Summaries, Tables & Tests<br />
Summary Statistics<br />
Summary Statistics<br />
The Summarize - Summary Statistics dialog box opens.<br />
2. Select ca3 from the drop-down box <strong>for</strong> Variables<br />
3. Under “Options” in this tab, select Standard<br />
Display .<br />
4. Click on the “by/if/in” tab.<br />
5. Click in the box “Repeat command <strong>for</strong><br />
groups defined by”<br />
6. In the box below this option, select ca2<br />
7. Click on the copy button, switch to the do-file<br />
editor and paste. Switch back to click the Ok<br />
button. The command will be executed.<br />
This command calculates the means of the variable ca3<br />
(age) separately <strong>for</strong> each different value of the variable<br />
ca2 (relation to head) including the system missing<br />
value.<br />
39


