International Organization for Migration (IOM)
International Organization for Migration (IOM)
International Organization for Migration (IOM)
Create successful ePaper yourself
Turn your PDF publications into a flip-book with our unique Google optimized e-Paper software.
Improving Access to Labour market In<strong>for</strong>mation <strong>for</strong> migrants and employers<br />
12<br />
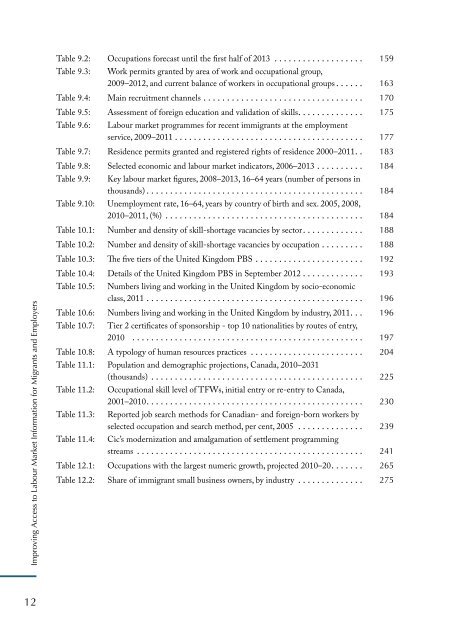
Table 9.2: Occupations <strong>for</strong>ecast until the first half of 2013 . . . . . . . . . . . . . . . . . . . 159<br />
Table 9.3: Work permits granted by area of work and occupational group,<br />
2009–2012, and current balance of workers in occupational groups . . . . . . 163<br />
Table 9.4: Main recruitment channels . . . . . . . . . . . . . . . . . . . . . . . . . . . . . . . . . . 170<br />
Table 9.5: Assessment of <strong>for</strong>eign education and validation of skills. . . . . . . . . . . . . . 175<br />
Table 9.6: Labour market programmes <strong>for</strong> recent immigrants at the employment<br />
service, 2009–2011 . . . . . . . . . . . . . . . . . . . . . . . . . . . . . . . . . . . . . . . . 177<br />
Table 9.7: Residence permits granted and registered rights of residence 2000–2011 . . 183<br />
Table 9.8: Selected economic and labour market indicators, 2006–2013 . . . . . . . . . . 184<br />
Table 9.9: Key labour market figures, 2008–2013, 16–64 years (number of persons in<br />
thousands) . . . . . . . . . . . . . . . . . . . . . . . . . . . . . . . . . . . . . . . . . . . . . . 184<br />
Table 9.10: Unemployment rate, 16–64, years by country of birth and sex. 2005, 2008,<br />
2010–2011, (%) . . . . . . . . . . . . . . . . . . . . . . . . . . . . . . . . . . . . . . . . . . 184<br />
Table 10.1: Number and density of skill-shortage vacancies by sector . . . . . . . . . . . . . 188<br />
Table 10.2: Number and density of skill-shortage vacancies by occupation . . . . . . . . . 188<br />
Table 10.3: The five tiers of the United Kingdom PBS . . . . . . . . . . . . . . . . . . . . . . . 192<br />
Table 10.4: Details of the United Kingdom PBS in September 2012 . . . . . . . . . . . . . 193<br />
Table 10.5: Numbers living and working in the United Kingdom by socio-economic<br />
class, 2011 . . . . . . . . . . . . . . . . . . . . . . . . . . . . . . . . . . . . . . . . . . . . . . 196<br />
Table 10.6: Numbers living and working in the United Kingdom by industry, 2011 . . . 196<br />
Table 10.7: Tier 2 certificates of sponsorship - top 10 nationalities by routes of entry,<br />
2010 . . . . . . . . . . . . . . . . . . . . . . . . . . . . . . . . . . . . . . . . . . . . . . . . . 197<br />
Table 10.8: A typology of human resources practices . . . . . . . . . . . . . . . . . . . . . . . . 204<br />
Table 11.1: Population and demographic projections, Canada, 2010–2031<br />
(thousands) . . . . . . . . . . . . . . . . . . . . . . . . . . . . . . . . . . . . . . . . . . . . . 225<br />
Table 11.2: Occupational skill level of TFWs, initial entry or re-entry to Canada,<br />
2001–2010 . . . . . . . . . . . . . . . . . . . . . . . . . . . . . . . . . . . . . . . . . . . . . . 230<br />
Table 11.3: Reported job search methods <strong>for</strong> Canadian- and <strong>for</strong>eign-born workers by<br />
selected occupation and search method, per cent, 2005 . . . . . . . . . . . . . . 239<br />
Table 11.4: Cic’s modernization and amalgamation of settlement programming<br />
streams . . . . . . . . . . . . . . . . . . . . . . . . . . . . . . . . . . . . . . . . . . . . . . . . 241<br />
Table 12.1: Occupations with the largest numeric growth, projected 2010–20 . . . . . . . 265<br />
Table 12.2: Share of immigrant small business owners, by industry . . . . . . . . . . . . . . 275


