

International Organization for Migration (IOM)
International Organization for Migration (IOM)
International Organization for Migration (IOM)

You also want an ePaper? Increase the reach of your titles
YUMPU automatically turns print PDFs into web optimized ePapers that Google loves.
Improving Access to Labour market In<strong>for</strong>mation <strong>for</strong> migrants and employers<br />
196<br />
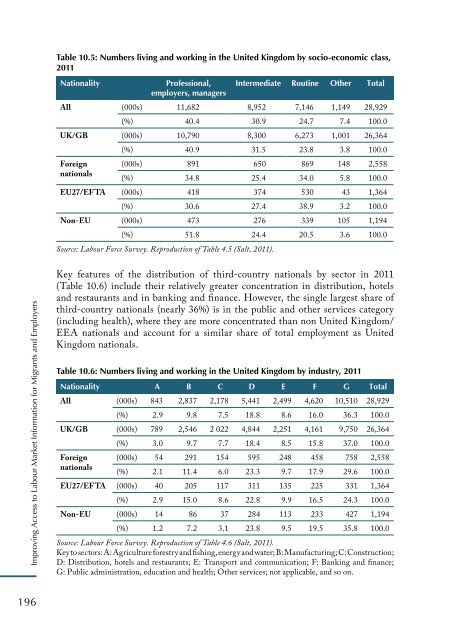
Table 10.5: Numbers living and working in the United Kingdom by socio-economic class,<br />
2011<br />
Nationality Professional,<br />
employers, managers<br />
Intermediate Routine Other Total<br />
All (000s) 11,682 8,952 7,146 1,149 28,929<br />
(%) 40.4 30.9 24.7 7.4 100.0<br />
UK/GB (000s) 10,790 8,300 6,273 1,001 26,364<br />
Foreign<br />
nationals<br />
(%) 40.9 31.5 23.8 3.8 100.0<br />
(000s) 891 650 869 148 2,558<br />
(%) 34.8 25.4 34.0 5.8 100.0<br />
EU27/EFTA (000s) 418 374 530 43 1,364<br />
(%) 30.6 27.4 38.9 3.2 100.0<br />
Non-EU (000s) 473 276 339 105 1,194<br />
(%) 51.8 24.4 20.5 3.6 100.0<br />
Source: Labour Force Survey. Reproduction of Table 4.5 (Salt, 2011).<br />
Key features of the distribution of third-country nationals by sector in 2011<br />
(Table 10.6) include their relatively greater concentration in distribution, hotels<br />
and restaurants and in banking and finance. However, the single largest share of<br />
third-country nationals (nearly 36%) is in the public and other services category<br />
(including health), where they are more concentrated than non United Kingdom/<br />
EEA nationals and account <strong>for</strong> a similar share of total employment as United<br />
Kingdom nationals.<br />
Table 10.6: Numbers living and working in the United Kingdom by industry, 2011<br />
Nationality A B C D E F G Total<br />
All (000s) 843 2,837 2,178 5,441 2,499 4,620 10,510 28,929<br />
(%) 2.9 9.8 7.5 18.8 8.6 16.0 36.3 100.0<br />
UK/GB (000s) 789 2,546 2 022 4,844 2,251 4,161 9,750 26,364<br />
Foreign<br />
nationals<br />
(%) 3.0 9.7 7.7 18.4 8.5 15.8 37.0 100.0<br />
(000s) 54 291 154 595 248 458 758 2,558<br />
(%) 2.1 11.4 6.0 23.3 9.7 17.9 29.6 100.0<br />
EU27/EFTA (000s) 40 205 117 311 135 225 331 1,364<br />
(%) 2.9 15.0 8.6 22.8 9.9 16.5 24.3 100.0<br />
Non-EU (000s) 14 86 37 284 113 233 427 1,194<br />
(%) 1.2 7.2 3.1 23.8 9.5 19.5 35.8 100.0<br />
Source: Labour Force Survey. Reproduction of Table 4.6 (Salt, 2011).<br />
Key to sectors: A: Agriculture <strong>for</strong>estry and fishing, energy and water; B: Manufacturing; C: Construction;<br />
D: Distribution, hotels and restaurants; E: Transport and communication; F: Banking and finance;<br />
G: Public administration, education and health; Other services; not applicable, and so on.