

International Organization for Migration (IOM)
International Organization for Migration (IOM)
International Organization for Migration (IOM)

Create successful ePaper yourself
Turn your PDF publications into a flip-book with our unique Google optimized e-Paper software.
to 2011. Considering that the number is 13,500 up until August 2012, we can expect<br />
an increase in labour migration in 2012. The majority of the labour migrants, close to<br />
80 per cent, are male. In terms of the labour market as a whole, labour immigration<br />
remains marginal, except in a few sectors, such as computer professionals.<br />
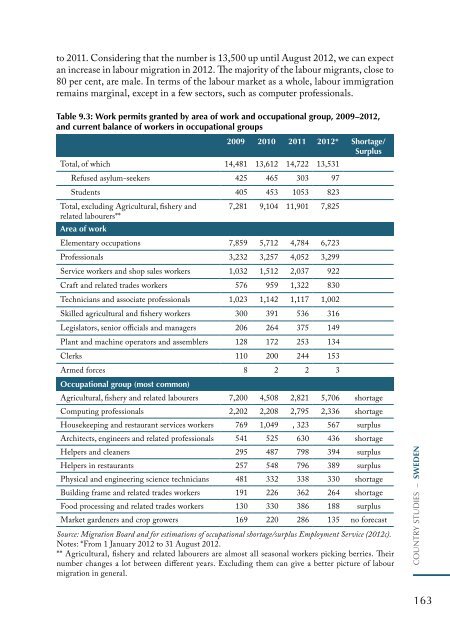
Table 9.3: Work permits granted by area of work and occupational group, 2009–2012,<br />
and current balance of workers in occupational groups<br />
2009 2010 2011 2012* Shortage/<br />
Surplus<br />
Total, of which 14,481 13,612 14,722 13,531<br />
Refused asylum-seekers 425 465 303 97<br />
Students 405 453 1053 823<br />
Total, excluding Agricultural, fishery and<br />
related labourers**<br />
Area of work<br />
7,281 9,104 11,901 7,825<br />
Elementary occupations 7,859 5,712 4,784 6,723<br />
Professionals 3,232 3,257 4,052 3,299<br />
Service workers and shop sales workers 1,032 1,512 2,037 922<br />
Craft and related trades workers 576 959 1,322 830<br />
Technicians and associate professionals 1,023 1,142 1,117 1,002<br />
Skilled agricultural and fishery workers 300 391 536 316<br />
Legislators, senior officials and managers 206 264 375 149<br />
Plant and machine operators and assemblers 128 172 253 134<br />
Clerks 110 200 244 153<br />
Armed <strong>for</strong>ces 8 2 2 3<br />
Occupational group (most common)<br />
Agricultural, fishery and related labourers 7,200 4,508 2,821 5,706 shortage<br />
Computing professionals 2,202 2,208 2,795 2,336 shortage<br />
Housekeeping and restaurant services workers 769 1,049 , 323 567 surplus<br />
Architects, engineers and related professionals 541 525 630 436 shortage<br />
Helpers and cleaners 295 487 798 394 surplus<br />
Helpers in restaurants 257 548 796 389 surplus<br />
Physical and engineering science technicians 481 332 338 330 shortage<br />
Building frame and related trades workers 191 226 362 264 shortage<br />
Food processing and related trades workers 130 330 386 188 surplus<br />
Market gardeners and crop growers 169 220 286 135 no <strong>for</strong>ecast<br />
Source: <strong>Migration</strong> Board and <strong>for</strong> estimations of occupational shortage/surplus Employment Service (2012c).<br />
Notes: *From 1 January 2012 to 31 August 2012.<br />
** Agricultural, fishery and related labourers are almost all seasonal workers picking berries. Their<br />
number changes a lot between different years. Excluding them can give a better picture of labour<br />
migration in general.<br />
country studIes – SWEDEN<br />
163