

International Organization for Migration (IOM)
International Organization for Migration (IOM)
International Organization for Migration (IOM)

You also want an ePaper? Increase the reach of your titles
YUMPU automatically turns print PDFs into web optimized ePapers that Google loves.
Improving Access to Labour market In<strong>for</strong>mation <strong>for</strong> migrants and employers<br />
224<br />
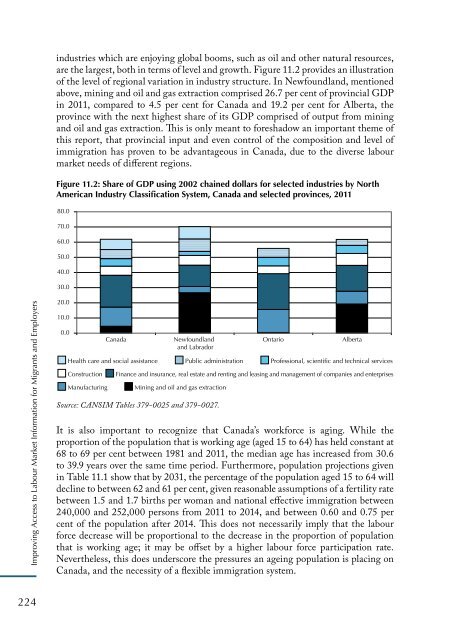
industries which are enjoying global booms, such as oil and other natural resources,<br />
are the largest, both in terms of level and growth. Figure 11.2 provides an illustration<br />
of the level of regional variation in industry structure. In Newfoundland, mentioned<br />
above, mining and oil and gas extraction comprised 26.7 per cent of provincial GDP<br />
in 2011, compared to 4.5 per cent <strong>for</strong> Canada and 19.2 per cent <strong>for</strong> Alberta, the<br />
province with the next highest share of its GDP comprised of output from mining<br />
and oil and gas extraction. This is only meant to <strong>for</strong>eshadow an important theme of<br />
this report, that provincial input and even control of the composition and level of<br />
immigration has proven to be advantageous in Canada, due to the diverse labour<br />
market needs of different regions.<br />
Figure 11.2: Share of GDP using 2002 chained dollars <strong>for</strong> selected industries by North<br />
American Industry Classification System, Canada and selected provinces, 2011<br />
80.0<br />
70.0<br />
60.0<br />
50.0<br />
40.0<br />
30.0<br />
20.0<br />
10.0<br />
0.0<br />
Canada Newfoundland<br />
and Labrador<br />
Source: CANSIM Tables 379-0025 and 379-0027.<br />
Ontario Alberta<br />
Health care and social assistance Public administration Professional, scientific and technical services<br />
Construction Finance and insurance, real estate and renting and leasing and management of companies and enterprises<br />
Manufacturing Mining and oil and gas extraction<br />
It is also important to recognize that Canada’s work<strong>for</strong>ce is aging. While the<br />
proportion of the population that is working age (aged 15 to 64) has held constant at<br />
68 to 69 per cent between 1981 and 2011, the median age has increased from 30.6<br />
to 39.9 years over the same time period. Furthermore, population projections given<br />
in Table 11.1 show that by 2031, the percentage of the population aged 15 to 64 will<br />
decline to between 62 and 61 per cent, given reasonable assumptions of a fertility rate<br />
between 1.5 and 1.7 births per woman and national effective immigration between<br />
240,000 and 252,000 persons from 2011 to 2014, and between 0.60 and 0.75 per<br />
cent of the population after 2014. This does not necessarily imply that the labour<br />
<strong>for</strong>ce decrease will be proportional to the decrease in the proportion of population<br />
that is working age; it may be offset by a higher labour <strong>for</strong>ce participation rate.<br />
Nevertheless, this does underscore the pressures an ageing population is placing on<br />
Canada, and the necessity of a flexible immigration system.