- Page 1 and 2:
Australian Dietary Guidelines Incor
- Page 3 and 4:
Australian Dietary Guidelines Austr
- Page 5 and 6:
2.4.4 Practical considerations: Lea
- Page 7 and 8:
1. Introduction 1.1 Why the Guideli
- Page 9 and 10:
income, education, cultural influen
- Page 11 and 12:
The Evidence Report (A review of th
- Page 13 and 14:
1.4 How the Guidelines were develop
- Page 15 and 16:
Levels of evidence in public health
- Page 17 and 18:
the study results were generalisabl
- Page 19 and 20:
Table 1.1: Changes in macronutrient
- Page 21 and 22:
population. NHMRC intends to work w
- Page 23 and 24:
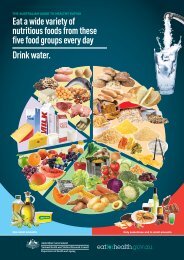
Figure 1.2: Australian Guide to Hea
- Page 25 and 26:
Executive Summary Dietary patterns
- Page 27 and 28:
Consuming a wide variety of foods m
- Page 29 and 30:
varieties within each food group, f
- Page 31 and 32:
2.1.4.6 People in lower socioeconom
- Page 33 and 34:
vegetable intake and cancer has foc
- Page 35 and 36:
Endometrial, Ovarian and pancreatic
- Page 37 and 38:
2.2.3.2 Cancer Colorectal cancer: E
- Page 39 and 40:
2.2.4.2 Cancer Alimentary tract can
- Page 41 and 42:
2.2.5.2 Cancer mechanisms There is
- Page 43 and 44:
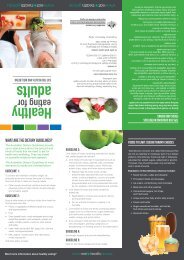
Table 2.1: Recommended number of se
- Page 45 and 46:
increasing appetites. Unless prescr
- Page 47 and 48:
2.3.2.1 Cardiovascular disease, typ
- Page 49 and 50:
Table 2.3: Recommended number of se
- Page 51 and 52:
2.4 Lean meat and poultry, fish, eg
- Page 53 and 54:
interpret because of widely varying
- Page 55 and 56:
2.4.2.3.1 Fish: Cardiovascular dise
- Page 57 and 58:
Smoked, salted and chemically prese
- Page 59 and 60:
Depending on age and sex, health be
- Page 61 and 62:
2.4.4.6 Vegetarians For several nut
- Page 63 and 64:
Evidence Statement Grade Consumptio
- Page 65 and 66:
2.5.3 How drinking milk and eating
- Page 67 and 68:
2.5.4.1 Pregnant and breastfeeding
- Page 69 and 70:
the recent review [14]. Many common
- Page 71 and 72:
2.6.2.3 Other conditions Dental car
- Page 73 and 74:
Where to next Both the quality and
- Page 75 and 76:
Executive summary This Guideline em
- Page 77 and 78:
3.1.2 The evidence for ‘limiting
- Page 79 and 80:
In the longer term, the review cond
- Page 81 and 82:
The P:M:S ratio is a useful tool in
- Page 83 and 84:
3.2.2 The evidence for ‘limiting
- Page 85 and 86:
3.2.3 How limiting intake of foods
- Page 87 and 88:
3.2.4.4 Older people Taste percepti
- Page 89 and 90:
No large studies have measured the
- Page 91 and 92:
Excess weight: Many foods containin
- Page 93 and 94:
etter health outcomes than those wh
- Page 95 and 96:
Evidence Statement Grade Consumptio
- Page 97 and 98:
Dementia: The evidence suggests an
- Page 99 and 100:
Drinking coffee, having a cold show
- Page 101 and 102:
In the absence of any research to q
- Page 103 and 104:
Executive summary Healthy weight is
- Page 105 and 106:
prevalence of obesity alone is high
- Page 107 and 108:
Compared to having a BMI between 18
- Page 109 and 110:
4.1.3.2 Energy intake and trend dat
- Page 111 and 112:
4.1.3.4 Energy intake from specific
- Page 113 and 114:
4.1.4.2 Benefits of physical activi
- Page 115 and 116:
4.2.1 Primary prevention Diet and p
- Page 117 and 118:
and consistent evidence that dietar
- Page 119 and 120:
4.2.2 Secondary prevention Behaviou
- Page 121 and 122:
Table 4.4 A stepped model for the m
- Page 123 and 124:
Taller or larger and more active ad
- Page 125 and 126:
Table 4.5 2010 Institute of Medicin
- Page 127 and 128:
For older, taller or more active ch
- Page 129 and 130:
Most older people will benefit from
- Page 131 and 132: 5. Encourage and support breastfeed
- Page 133 and 134: 5.1 Setting the scene The World Hea
- Page 135 and 136: Evidence Statement Grade Exclusive
- Page 137 and 138: Table 5.1 Factors associated with d
- Page 139 and 140: 5.2.4 Other benefits Sudden Infant
- Page 141 and 142: 5.3.1.3 Mothers in the workplace Ev
- Page 143 and 144: 5.3.1.3 Community support The succe
- Page 145 and 146: Executive summary More than five mi
- Page 147 and 148: [929]. Fresh fruit and vegetables c
- Page 149 and 150: contamination (see above) avoided.
- Page 151 and 152: 1989 - 1995 Composition of Foods, A
- Page 153 and 154: 2001 Eat Well Australia: An Agenda
- Page 155 and 156: 2011 A Review of the Evidence to Ad
- Page 157 and 158: Professor Dorothy Mackerras Dr Dav
- Page 159 and 160: Level III-2 - A comparative study w
- Page 161 and 162: food options to meet additional ene
- Page 163 and 164: Appendix 3. Assessing growth and he
- Page 165 and 166: Table A3.1 International BMI cut-of
- Page 167 and 168: A3.1.6 Z-scores and percentiles: Co
- Page 169 and 170: Appendix 4. Physical activity guide
- Page 171 and 172: Suggested activities include: mode
- Page 173 and 174: Appendix 5. Studies examining the h
- Page 175 and 176: that further specific studies are r
- Page 177 and 178: Table A6.2 Energy and alcohol conte
- Page 179 and 180: The economic, social and cultural f
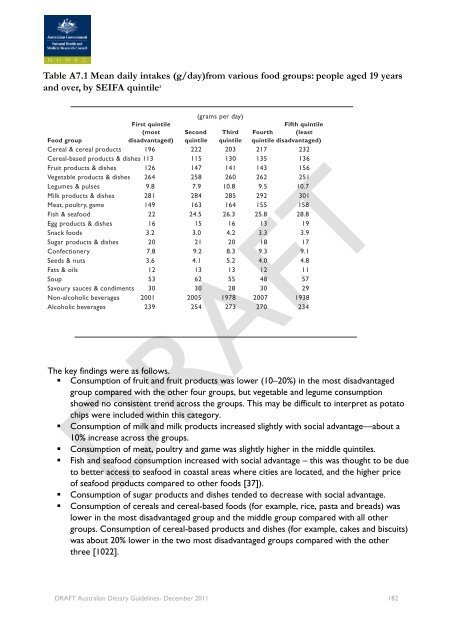
- Page 181: A diet consistent with the Guidelin
- Page 185 and 186: A7.4 Aboriginal and Torres Strait I
- Page 187 and 188: A7.4.3.2. Aboriginal people living
- Page 189 and 190: Mortality rates for people born ove
- Page 191 and 192: Appendix 8: Glossary Adequate Intak
- Page 193 and 194: Carbohydrates Carbohydrates are pol
- Page 195 and 196: Exclusive breastfeeding Means an in
- Page 197 and 198: Legume/Beans Refers to all forms of
- Page 199 and 200: Older adults For the purposes of th
- Page 201 and 202: Reduced fat products For a food to
- Page 203 and 204: celery and asparagus), gourd vegeta
- Page 205 and 206: Evidence Statement Grade Fruit Cons
- Page 207 and 208: Table A9.2: Evidence statements (Gr
- Page 209 and 210: References 1. Rayner, M. and P. Sca
- Page 211 and 212: 27. Wilkinson, R. and M. Marmot, So
- Page 213 and 214: 54. Hawkins, S.S., T.J. Cole, and C
- Page 215 and 216: 81. Hesketh, K., M. Wake, and E. Wa
- Page 217 and 218: 107. McCullough, M.L., et al., Diet
- Page 219 and 220: 135. Brimblecombe, J.K. and K. O’
- Page 221 and 222: 162. Kreimer, A.R., et al., Diet an
- Page 223 and 224: 189. Ward, H.A., et al., Breast, co
- Page 225 and 226: 216. Paolini, M., et al., Beta-caro
- Page 227 and 228: 244. Kelly, S.A., et al., Wholegrai
- Page 229 and 230: 270. Williams, P.G., et al., Cereal
- Page 231 and 232: 297. Garcia-Closas, R., et al., Foo
- Page 233 and 234:
324. Maclean, C.H., et al., Effects
- Page 235 and 236:
349. Vander Wal, J.S., et al., Egg
- Page 237 and 238:
376. Elwood, P.C., et al., The surv
- Page 239 and 240:
404. Javaid, M.K., et al., Maternal
- Page 241 and 242:
430. Lagiou, P., et al., Intake of
- Page 243 and 244:
458. Vartanian, L.R., M.B. Schwartz
- Page 245 and 246:
486. Lopez-Ridaura, R., et al., Mag
- Page 247 and 248:
512. Kratz, M., et al., The impact
- Page 249 and 250:
537. Daniels, S.R. and F.R. Greer,
- Page 251 and 252:
562. Cook, N.R., et al., Joint effe
- Page 253 and 254:
588. Burt, B.A., et al., The effect
- Page 255 and 256:
615. Ronksley, P.E., et al., Associ
- Page 257 and 258:
642. Purdue, M.P., et al., Type of
- Page 259 and 260:
669. Arntzen, K., et al., Moderate
- Page 261 and 262:
696. Rokholm, B., J.L. Baker, and T
- Page 263 and 264:
724. Bensimhon, D.R., W.E. Kraus, a
- Page 265 and 266:
750. Centre for Epidemiology and Re
- Page 267 and 268:
776. Monasta, L., et al., Early-lif
- Page 269 and 270:
803. Prentice, A.M. and S.A. Jebb,
- Page 271 and 272:
830. Callaway, L.K., et al., The pr
- Page 273 and 274:
857. Australian Institute of Health
- Page 275 and 276:
885. Demmelmair, H., J. von Rosen,
- Page 277 and 278:
911. Duong, D.V., C.W. Binns, and A
- Page 279 and 280:
940. Cashel K, L.J., NUTTAB89-Nutri
- Page 281 and 282:
http://www.health.gov.au/internet/m
- Page 283 and 284:
995. Atlantis, E., E.H. Barnes, and
- Page 285 and 286:
1021. Australian Bureau of Statisti
- Page 287 and 288:
1049. Altman, J., Hunter-gatherers