- Page 3:
Marine and Coastal Protected Areas
- Page 6 and 7:
The designation of geographical ent
- Page 8 and 9:
viii MARINE AND COASTAL PROTECTED A
- Page 10 and 11:
x MARINE AND COASTAL PROTECTED AREA
- Page 13:
Acknowledgements This book largely
- Page 17 and 18:
Table of contents Part I Creating M
- Page 19 and 20:
Table of Contents 4.6 Economic Crit
- Page 21:
Table of Contents Review of Highlig
- Page 24 and 25:
2 MARINE AND COASTAL PROTECTED AREA
- Page 26 and 27:
4 MARINE AND COASTAL PROTECTED AREA
- Page 28 and 29:
6 MARINE AND COASTAL PROTECTED AREA
- Page 30 and 31:
8 MARINE AND COASTAL PROTECTED AREA
- Page 32 and 33:
10 MARINE AND COASTAL PROTECTED ARE
- Page 35 and 36:
The Roles of Protected Areas Marine
- Page 37 and 38:
PART I The Roles of Protected Areas
- Page 39 and 40:
PART I The Roles of Protected Areas
- Page 41 and 42:
PART I The Roles of Protected Areas
- Page 43 and 44:
PART I The Roles of Protected Areas
- Page 45 and 46:
PART I The Roles of Protected Areas
- Page 47 and 48:
Box I-1. Ecosystem Conservation: La
- Page 49 and 50:
harvest of edible resources (e.g.,
- Page 51 and 52:
PART I The Roles of Protected Areas
- Page 53 and 54:
Photo by R. Salm. PART I The Roles
- Page 55 and 56: PART I The Roles of Protected Areas
- Page 57: PART I The Roles of Protected Areas
- Page 60 and 61: 38 MARINE AND COASTAL PROTECTED ARE
- Page 62 and 63: 40 MARINE AND COASTAL PROTECTED ARE
- Page 64 and 65: 42 MARINE AND COASTAL PROTECTED ARE
- Page 66 and 67: 44 MARINE AND COASTAL PROTECTED ARE
- Page 68 and 69: 46 MARINE AND COASTAL PROTECTED ARE
- Page 70 and 71: 48 MARINE AND COASTAL PROTECTED ARE
- Page 72 and 73: 50 MARINE AND COASTAL PROTECTED ARE
- Page 74 and 75: 52 MARINE AND COASTAL PROTECTED ARE
- Page 76 and 77: 54 MARINE AND COASTAL PROTECTED ARE
- Page 78 and 79: 56 MARINE AND COASTAL PROTECTED ARE
- Page 80 and 81: 58 MARINE AND COASTAL PROTECTED ARE
- Page 82 and 83: 60 MARINE AND COASTAL PROTECTED ARE
- Page 84 and 85: 62 MARINE AND COASTAL PROTECTED ARE
- Page 86 and 87: 64 MARINE AND COASTAL PROTECTED ARE
- Page 88 and 89: 66 MARINE AND COASTAL PROTECTED ARE
- Page 90 and 91: 68 MARINE AND COASTAL PROTECTED ARE
- Page 92 and 93: 70 MARINE AND COASTAL PROTECTED ARE
- Page 94 and 95: 72 MARINE AND COASTAL PROTECTED ARE
- Page 96 and 97: 74 MARINE AND COASTAL PROTECTED ARE
- Page 98 and 99: 76 MARINE AND COASTAL PROTECTED ARE
- Page 100 and 101: 78 MARINE AND COASTAL PROTECTED ARE
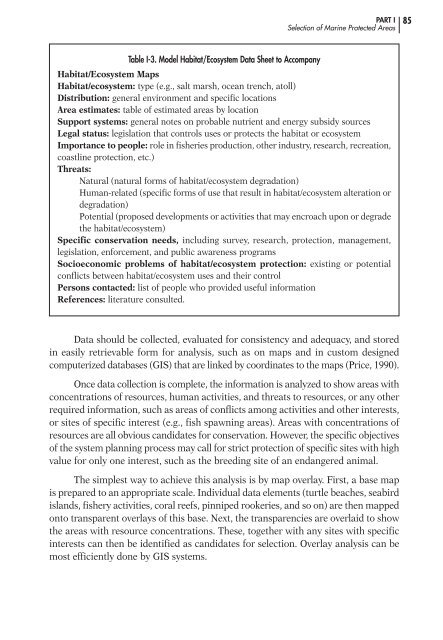
- Page 103 and 104: Selection of Marine Protected Areas
- Page 105: PART I Selection of Marine Protecte
- Page 109 and 110: PART I Selection of Marine Protecte
- Page 111 and 112: 4.5 Social Criteria Social and cult
- Page 113 and 114: 4.6 Economic Criteria Economic bene
- Page 115 and 116: PART I Selection of Marine Protecte
- Page 117: PART I Selection of Marine Protecte
- Page 120 and 121: 98 MARINE AND COASTAL PROTECTED ARE
- Page 122 and 123: 100 MARINE AND COASTAL PROTECTED AR
- Page 124 and 125: 102 MARINE AND COASTAL PROTECTED AR
- Page 126 and 127: 104 MARINE AND COASTAL PROTECTED AR
- Page 128 and 129: 106 MARINE AND COASTAL PROTECTED AR
- Page 130 and 131: 108 MARINE AND COASTAL PROTECTED AR
- Page 132 and 133: 110 MARINE AND COASTAL PROTECTED AR
- Page 134 and 135: 112 MARINE AND COASTAL PROTECTED AR
- Page 136 and 137: 114 MARINE AND COASTAL PROTECTED AR
- Page 138 and 139: 116 MARINE AND COASTAL PROTECTED AR
- Page 140 and 141: 118 MARINE AND COASTAL PROTECTED AR
- Page 142 and 143: 120 MARINE AND COASTAL PROTECTED AR
- Page 144 and 145: 122 MARINE AND COASTAL PROTECTED AR
- Page 146 and 147: 124 MARINE AND COASTAL PROTECTED AR
- Page 148 and 149: 126 MARINE AND COASTAL PROTECTED AR
- Page 150 and 151: 128 MARINE AND COASTAL PROTECTED AR
- Page 153 and 154: Institutional and Legal Framework M
- Page 155 and 156: 6.2 Diagnosis PART I Institutional
- Page 157 and 158:
Box I-16. Historical Rights PART I
- Page 159 and 160:
PART I Institutional and Legal Fram
- Page 161 and 162:
Box I-17. Funding MPAs through “B
- Page 163 and 164:
PART I Institutional and Legal Fram
- Page 165 and 166:
Box I-19: The Galapagos Ley Especia
- Page 167 and 168:
PART I Institutional and Legal Fram
- Page 169 and 170:
PART I Institutional and Legal Fram
- Page 171 and 172:
PART I Institutional and Legal Fram
- Page 173 and 174:
PART I Institutional and Legal Fram
- Page 175 and 176:
PART I Institutional and Legal Fram
- Page 177 and 178:
PART I Institutional and Legal Fram
- Page 179:
PART I Institutional and Legal Fram
- Page 183 and 184:
Protected Areas for Coral Reefs Cor
- Page 185 and 186:
PART II Protected Areas for Coral R
- Page 187 and 188:
FIGURE II-4. PART II Protected Area
- Page 189 and 190:
into the sea (Salm, 1981a). After t
- Page 191 and 192:
1.4 Global Status of Coral Reef Pro
- Page 193 and 194:
PART II Protected Areas for Coral R
- Page 195 and 196:
PART II Protected Areas for Coral R
- Page 197 and 198:
Table II-4: Diversity of Corals on
- Page 199 and 200:
Mangroves, lagoons, Introduce disso
- Page 201 and 202:
PART II Protected Areas for Coral R
- Page 203 and 204:
PART II Protected Areas for Coral R
- Page 205 and 206:
PART II Protected Areas for Coral R
- Page 207 and 208:
Protected Areas for Lagoons and Est
- Page 209 and 210:
PART II Protected Areas for Lagoons
- Page 211 and 212:
Wetlands provide opportunities for
- Page 213 and 214:
PART II Protected Areas for Lagoons
- Page 215 and 216:
Pollution can be very serious, caus
- Page 217 and 218:
PART II Protected Areas for Lagoons
- Page 219 and 220:
PART II Protected Areas for Lagoons
- Page 221 and 222:
PART II Protected Areas for Lagoons
- Page 223 and 224:
PART II Protected Areas for Lagoons
- Page 225 and 226:
2.8 General Information Needs PART
- Page 227 and 228:
PART II Protected Areas for Lagoons
- Page 229:
- Management plans for lagoons/estu
- Page 232 and 233:
210 MARINE AND COASTAL PROTECTED AR
- Page 234 and 235:
212 MARINE AND COASTAL PROTECTED AR
- Page 236 and 237:
214 MARINE AND COASTAL PROTECTED AR
- Page 238 and 239:
216 MARINE AND COASTAL PROTECTED AR
- Page 240 and 241:
218 MARINE AND COASTAL PROTECTED AR
- Page 242 and 243:
220 MARINE AND COASTAL PROTECTED AR
- Page 244 and 245:
222 MARINE AND COASTAL PROTECTED AR
- Page 246 and 247:
224 MARINE AND COASTAL PROTECTED AR
- Page 248 and 249:
226 MARINE AND COASTAL PROTECTED AR
- Page 250 and 251:
228 MARINE AND COASTAL PROTECTED AR
- Page 252 and 253:
230 MARINE AND COASTAL PROTECTED AR
- Page 254 and 255:
232 MARINE AND COASTAL PROTECTED AR
- Page 256 and 257:
234 MARINE AND COASTAL PROTECTED AR
- Page 258 and 259:
236 MARINE AND COASTAL PROTECTED AR
- Page 260 and 261:
238 MARINE AND COASTAL PROTECTED AR
- Page 262 and 263:
240 MARINE AND COASTAL PROTECTED AR
- Page 264 and 265:
242 MARINE AND COASTAL PROTECTED AR
- Page 267 and 268:
Review of Highlights of the Case Hi
- Page 269 and 270:
PART III Case Histories of Marine P
- Page 271 and 272:
Box III-1. The Relationship between
- Page 273 and 274:
PART III Case Histories of Marine P
- Page 275 and 276:
PART III Case Histories of Marine P
- Page 277 and 278:
PART III Case Histories of Marine P
- Page 279 and 280:
PART III Case Histories of Marine P
- Page 281 and 282:
PART III Case Histories of Marine P
- Page 283 and 284:
PART III Case Histories of Marine P
- Page 285 and 286:
PART III Case Histories of Marine P
- Page 287 and 288:
PART III Case Histories of Marine P
- Page 289 and 290:
PART III Case Histories of Marine P
- Page 291 and 292:
Negative lessons learned: High comm
- Page 293 and 294:
Background PART III Case Histories
- Page 295 and 296:
PART III Case Histories of Marine P
- Page 297 and 298:
PART III Case Histories of Marine P
- Page 299 and 300:
PART III Case Histories of Marine P
- Page 301 and 302:
PART III Case Histories of Marine P
- Page 303 and 304:
PART III Case Histories of Marine P
- Page 305 and 306:
PART III Case Histories of Marine P
- Page 307 and 308:
The start of the SMMA PART III Case
- Page 309 and 310:
PART III Case Histories of Marine P
- Page 311 and 312:
PART III Case Histories of Marine P
- Page 313 and 314:
PART III Case Histories of Marine P
- Page 315 and 316:
PART III Case Histories of Marine P
- Page 317 and 318:
PART III Case Histories of Marine P
- Page 319 and 320:
PART III Case Histories of Marine P
- Page 321 and 322:
PART III Case Histories of Marine P
- Page 323 and 324:
Establishment of Ngeruangel Reserve
- Page 325 and 326:
PART III Case Histories of Marine P
- Page 327 and 328:
PART III Case Histories of Marine P
- Page 329 and 330:
PART III Case Histories of Marine P
- Page 331 and 332:
PART III Case Histories of Marine P
- Page 333 and 334:
PART III Case Histories of Marine P
- Page 335 and 336:
PART III Case Histories of Marine P
- Page 337 and 338:
PART III Case Histories of Marine P
- Page 339 and 340:
PART III Case Histories of Marine P
- Page 341 and 342:
PART III Case Histories of Marine P
- Page 343 and 344:
PART III Case Histories of Marine P
- Page 345 and 346:
PART III Case Histories of Marine P
- Page 347 and 348:
PART III Case Histories of Marine P
- Page 349 and 350:
PART III Case Histories of Marine P
- Page 351 and 352:
PART III Case Histories of Marine P
- Page 353 and 354:
PART III Case Histories of Marine P
- Page 355 and 356:
PART III Case Histories of Marine P
- Page 357 and 358:
PART III Case Histories of Marine P
- Page 359 and 360:
PART III Case Histories of Marine P
- Page 361 and 362:
Problem PART III Case Histories of
- Page 363 and 364:
PART III Case Histories of Marine P
- Page 365 and 366:
PART III Case Histories of Marine P
- Page 367 and 368:
PART III Case Histories of Marine P
- Page 369 and 370:
PART III Case Histories of Marine P
- Page 371 and 372:
The Initial Process PART III Case H
- Page 373 and 374:
PART III Case Histories of Marine P
- Page 375 and 376:
PART III Case Histories of Marine P
- Page 377:
1. Involving women in assessment an
- Page 381 and 382:
PART IV References Agardy, T.S. Mar
- Page 383 and 384:
PART IV References Davis-Case, D. 1
- Page 385 and 386:
PART IV References Hamilton, L. S.,
- Page 387 and 388:
PART IV References McNeely, J.A. 19
- Page 389 and 390:
PART IV References Saenger, P., E.
- Page 391 and 392:
PART IV References Terborgh, J. 197