- Page 1 and 2:
February 15-18, 2009 Washington Sta
- Page 3 and 4:
TABLE OF CONTENTS Preface..........
- Page 5 and 6:
STUDY On MORTALITY EGG Of Acipenser
- Page 7 and 8:
HEAVY METALS IN THE BIVALVE MOLLUSC
- Page 9 and 10:
THE POTENTIAL OF “LOST CROPS” I
- Page 11 and 12:
DIETARY CARBOHYDRATE LEVEL AFFECTS
- Page 13 and 14:
EFFICIENT AND RELIABLE PROTOCOLS FO
- Page 15 and 16:
MULITIVARIATE ANALYSIS OF THE GROWT
- Page 17 and 18:
NEW CONCEPTS FOR STUDY ON SURVIVAL,
- Page 19 and 20:
FORMULATION AND APPLICATON OF PROBI
- Page 21 and 22:
ALTERNATIVE USES FOR RETIRED CATFIS
- Page 23 and 24:
EFFECT OF FEED RATE ON FOOD CONSUMP
- Page 25 and 26:
UTILIZATION OF FISH PROCESSING BYPR
- Page 27 and 28:
STUDY OF LIMNOLOGICAL VARIABLES IN
- Page 29 and 30:
GROW-OUT PERFORMANCE OF NILE TILAPI
- Page 31 and 32:
INNOVATIVE USES FOR UNDER-UTILIZED
- Page 33 and 34:
STATISTICAL DESIGN AND ANALYSIS OF
- Page 35 and 36:
SEEPAGE LOSSES FROM EARTHEN AQUACUL
- Page 37 and 38:
EVALUATION OF BODY AND FILLET COMPO
- Page 39 and 40:
EFFECTS OF PHEROMONAL STEROIDS OR P
- Page 41 and 42:
EFFECTS OF DIETARY PREBIOTICS ON MI
- Page 43 and 44:
SOLDIER FLY PREPUPAE AS AN ALTERNAT
- Page 45 and 46:
ECONOMICS OF A SOFT-SHELL CRAYFISH
- Page 47 and 48:
ADVANCES IN THE CULTURE OF THE LANE
- Page 49 and 50:
DEVELOPMENT OF INTENSIVE CULTURE ME
- Page 51 and 52:
RECIRCULATING AQUACULTURE SYSTEM FO
- Page 53 and 54:
EVALUATION OF LARVAL FLORIDA POMPAN
- Page 55 and 56:
DEVELOPMENT OF A SELECTION INDEX ON
- Page 57 and 58:
EXPERIMENTAL USE OF ISOMETAMIDIUM C
- Page 59 and 60:
CHARACTERIZATION OF 14kDa APOLIPOPR
- Page 61 and 62:
EFFECT OF FEED DEPRIVATION AND INSU
- Page 63 and 64:
WRITING “SMART” OBJECTIVES FOR
- Page 65 and 66:
AQUACULTURE ONLINE: HOW PRODUCTION
- Page 67 and 68:
ENERGY USE, RESOURCE CONSUMPTION, A
- Page 69 and 70:
COMPARISON OF ENERGY AND RESOURCE C
- Page 71 and 72:
DEVELOPMENT OF STANDARDS FOR FISHER
- Page 73 and 74:
THE EFFECTS OF STOCKING DENSITY AND
- Page 75 and 76:
EVALUATION OF DIFFERENT ORGANIC FER
- Page 77 and 78:
RECLAIMED AQUACULTURE EFFLUENT FOR
- Page 79 and 80:
THE SYNERGISTIC USE OF DIETARY BIOT
- Page 81 and 82:
SELLING AQUACULTURE PRODUCTS IN KEN
- Page 83 and 84:
WATER QUALITY AND TREATMENT EFFICIE
- Page 85 and 86:
ALTERNATIVE FEEDING STRATEGIES TO I
- Page 87 and 88:
EVALUATION OF SOLVENT EXTRACTED, DE
- Page 89 and 90:
WILL DECREASE IN POND BANK PRICES I
- Page 91 and 92:
OUTREACH, ACCEPTANCE, AND SUCCESS O
- Page 93 and 94:
EVALUATION OF A POINT OF CARE BLOOD
- Page 95 and 96:
REPLICATION IN FIELD AND LAB EXPERI
- Page 97 and 98:
TWICE-ANNUALLY SPAWNING RAINBOW TRO
- Page 99 and 100:
CAN CROWDING DENSITY AFFECT ON BODY
- Page 101 and 102:
CHANGES OF RELATIVE EGG WEIGHT DURI
- Page 103 and 104:
CONSUMER SAFETY ASSESSMENTS FOR CUL
- Page 105 and 106:
SEAFOOD AT ITS BEST: A FOUR-LESSON
- Page 107 and 108:
OPTIMIZATION OF SHRIMP DIETS USING
- Page 109 and 110:
EVALUATING POND AQUACULTURE EFFLUEN
- Page 111 and 112:
EVALUATION OF STRESS-INDUCED CORTIS
- Page 113 and 114:
PERFORMANCE OF Litopenaeus vannamei
- Page 115 and 116:
THE NEAH BAY GEODUCK AQUACULTURE AN
- Page 117 and 118:
POST-KATRINA MARINE BAIT DEVELOPMEN
- Page 119 and 120:
PHARMACOKINETICS OF FLORFENICOL IN
- Page 121 and 122:
DELTA 6 DESATURASE GENE IS DIFFEREN
- Page 123 and 124:
INFLUENCE INDIVIDUAL AND MIXED HEAV
- Page 125 and 126:
FORMALIN TREATMENT FOR SAPROLEGNIA
- Page 127 and 128:
APPLICATION OF SCALE COVER GENE N F
- Page 129 and 130:
THE EFFECTS OF HIGH VS. LOW DISSOLV
- Page 131 and 132:
SEA TRIALS OF A SELF-PROPELLED OFFS
- Page 133 and 134:
DEVELOPMENT OF A VALUE-ADDED PRODUC
- Page 135 and 136:
THE EMERGENCE OF VIRAL HEMORRHAGIC
- Page 137 and 138:
COMPREHENSIVE QUALITY ASSESSMENT OF
- Page 139 and 140:
LIVE BAIT SHRIMP MARKETING IN THE G
- Page 141 and 142:
SPERM MOTILITY ACTIVATION IN THE ES
- Page 143 and 144:
ENERGY EFFICIENCY AND ENERGY USE RE
- Page 145 and 146:
CONCENTRATION OF ORGANIC MATERIAL I
- Page 147 and 148:
VHS BIOSECURITY WORKSHOPS AND THE D
- Page 149 and 150:
PROSPECTS FOR ENGINEERING SOYBEANS
- Page 151 and 152:
ROE AND CAVIAR BACTERIOLOGY: In viv
- Page 153 and 154:
A ZEBRAFISH MODEL TO INVESTIGATE TH
- Page 155 and 156:
SIZE AT SEXUAL MATURITY AND FECUNDI
- Page 157 and 158:
EFFECT OF HERBAL LEAF DECOCTION ON
- Page 159 and 160: AQAUFISH CRSP: FOSTERING THE DEVELO
- Page 161 and 162: STUDY ON POSSIBILITY OF PRODUCTION
- Page 163 and 164: HISTORY AND STATUS OF PADDLEFISH AQ
- Page 165 and 166: AN EVALUATION OF CHANNEL CATFISH EG
- Page 167 and 168: Macrobrachium rosenbergii NODAVIRUS
- Page 169 and 170: EFFECT OF TOTAL REPLACEMENT OF FISH
- Page 171 and 172: ON CHOICE AND USE OF STATISTICAL TO
- Page 173 and 174: TISSUE DISTRIBUTION OF LEPTIN-LIKE
- Page 175 and 176: PALM OIL EFFICACY IN OXIDATION STAB
- Page 177 and 178: A SPREADSHEET MODEL FOR FINANCIAL P
- Page 179 and 180: SUSCEPTIBILITY OF PACIFIC SALMONIDS
- Page 181 and 182: ALTERNATIVE USES FOR ALGAE PRODUCED
- Page 183 and 184: DEVELOPMENT OF SPF STOCKS OF BAIT S
- Page 185 and 186: GROWTH PERFORMANCE OF ATLANTIC COD
- Page 187 and 188: IDENTIFICATION, CLONING AND EXPRESS
- Page 189 and 190: INTENSIVE CULTIVATION OF Acartia to
- Page 191 and 192: ANALYZING RESULTS THROUGH TIME USIN
- Page 193 and 194: SLOPE RATIO ANALYSIS IS A ROBUST AN
- Page 195 and 196: THE USE OF HYDROGEN PEROXIDE (H 2 O
- Page 197 and 198: DETECTION OF YELLOW HEAD DISEASE IN
- Page 199 and 200: EFFECTS OF STANDARD AND HIGH-FAT DI
- Page 201 and 202: EFFECTS OF STANDARD AND HIGH-FAT DI
- Page 203 and 204: OPTIMIZING FEEDING STRATEGIES FOR T
- Page 205 and 206: ISOLATION, IDENTIFICATION AND BIOLO
- Page 207 and 208: MODELLING OF NUTRITIONAL REQUIREMEN
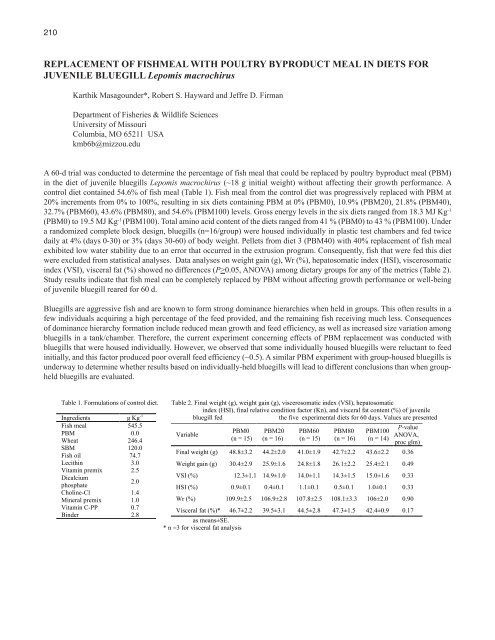
- Page 209: FATTY ACID COMPOSITION OF Artemia u
- Page 213 and 214: AQUAPLANT: A WEB-BASED TOOL FOR AQU
- Page 215 and 216: EFFICIENT OXYGENATION FOR SUSTAINAB
- Page 217 and 218: PRODUCTION OF Artemia CYSTS AND FLA
- Page 219 and 220: VARIATION OF EGG SIZE OF DOMESTIC W
- Page 221 and 222: BAITFISH AQUACULTURE IN THE MID-ATL
- Page 223 and 224: Aeromonas hydrophila SEPTICEMIA IN
- Page 225 and 226: PRELIMINARY NUTRITIONAL INVESTIGATI
- Page 227 and 228: HYDROGEN PEROXIDE TREATMENTS FOR CH
- Page 229 and 230: NUCLEOTIDE SEQUENCE VARIATIONS OF T
- Page 231 and 232: RESPONSE OF PACIFIC WHITE SHRIMP, L
- Page 233 and 234: SHRIMP RESEARCH ACTIVITIES AT OCEAN
- Page 235 and 236: THE IMPACT OF CATFISH IMPORTS ON TH
- Page 237 and 238: EFFECTS OF TWO DIETARY LIPID LEVELS
- Page 239 and 240: NOVEL COMPOUNDS AND OPPORTUNITIES F
- Page 241 and 242: HOLISTIC GOODNESS-OF-FIT: COMPARING
- Page 243 and 244: DESIGNING A SUPPLY CHAIN FOR MARINE
- Page 245 and 246: ONTOGENY AND CHARACTERIZATION OF SO
- Page 247 and 248: AMBIENT CONDITIONING AND ULTRASOUND
- Page 249 and 250: AQUACULTURE SAFETY IN KENTUCKY Tiff
- Page 251 and 252: SUCCESSFUL CULTURE OF PINFISH Lagod
- Page 253 and 254: PRELIMINARY STUDY OF THE EFFECTS OF
- Page 255 and 256: METHYLMERCURY CONCENTRATIONS FOUND
- Page 257 and 258: COMPARATIVE OXYGEN TOLERANCE OF BLU
- Page 259 and 260: A STANDARD GENETIC STOCK OF RAINBOW
- Page 261 and 262:
ADVANCES IN THE DEVELOPMENT OF THE
- Page 263 and 264:
ORGANIC SHRIMP PRODUCTION: AN ATTEM
- Page 265 and 266:
EFFECT OF STOCKING DENSITY AND FEED
- Page 267 and 268:
EVALUATION OF THE EFFECTS OF TEMPER
- Page 269 and 270:
EVALUATE THE OF PLANKTONIC AND BENT
- Page 271 and 272:
RISK EVALUATION TO AQUACULTURE POND
- Page 273 and 274:
EVALUATION OF CHANNEL CATFISH (Icta
- Page 275 and 276:
GREENHOUSE GAS EMISSIONS ASSOCIATED
- Page 277 and 278:
MULTIPLE COMPARISONS OF MEANS VS. R
- Page 279 and 280:
PUTTING TOGETHER A BUSINESS PLAN St
- Page 281 and 282:
MORPHOLOGICAL DESCRIPTION OF THE IN
- Page 283 and 284:
DETERMINING SIZE EFFECTS ON PHOSPHO
- Page 285 and 286:
EVALUATION OF MULTIPLE-BATCH CHANNE
- Page 287 and 288:
ENGINEERING OPTIMAL SEED PHOSPHORUS
- Page 289 and 290:
EFFECTS OF PREBIOTICS ON NUTRIENT D
- Page 291 and 292:
EVALUATION OF SYNTHETIC ASTAXANTHIN
- Page 293 and 294:
EFFECT OF ZOOPLANKTON DENSITY ON GR
- Page 295 and 296:
CORN DISTILLERS DRIED GRAINS WITH S
- Page 297 and 298:
EFFECT OF TEMPERATURE AND SALINITY
- Page 299 and 300:
NOAA-USDA JOINT INITIATIVE ON ALTER
- Page 301 and 302:
EFFECTS OF TEMPERATURE REGIME ON NI
- Page 303 and 304:
ARACHIDONIC ACID (20:4n-6) EFFECT O
- Page 305 and 306:
GROWTH RATE OF JUVENILE AMAZONIAN P
- Page 307 and 308:
EVALUATION OF THE PREBIOTIC GROBIOT
- Page 309 and 310:
GENETIC DIVERSITY OF CULTURED AND W
- Page 311 and 312:
PROGRAM EVALUATION Michael H. Schwa
- Page 313 and 314:
SENSORY ANALYSIS OF RAINBOW TROUT O
- Page 315 and 316:
POULTRY BY-PRODUCT MEAL- BASED PELL
- Page 317 and 318:
SOME COMMON DESIGN AND STATISTICAL
- Page 319 and 320:
PADDLEFISH SYMPOSIUM DEDICATION TO
- Page 321 and 322:
FORECASTING POND BANK PRICES OF CAT
- Page 323 and 324:
C-TERMINAL MODIFICATION MEDIATES BI
- Page 325 and 326:
THE UTILIZATION OF HISTOPATHOLOGY I
- Page 327 and 328:
USE OF FRESHWATER LOW VALUE FISH FO
- Page 329 and 330:
GROWTH OF PACIFIC WHITE SHRIMP Lito
- Page 331 and 332:
DEVELOPMENT OF SMALL-SCALE AQUACULT
- Page 333 and 334:
The acuTe ToxiciTy of copper To lar
- Page 335 and 336:
GROWTH OF FED GOLDEN SHINERS IN AQU
- Page 337 and 338:
THE SAFETY OF COPPER SULFATE TO CHA
- Page 339 and 340:
PRACTICAL APPLICATION OF AN INTEGRA
- Page 341 and 342:
DEVELOPMENT OF PARATRANSGENIC Artem
- Page 343 and 344:
EFFECTS OF LOW-PHOSPHORUS DIETS ON
- Page 345 and 346:
TREATMENT OF RECIRCULATING WATER US
- Page 347 and 348:
A LOW COST SMALL SCALE PRODUCTION S
- Page 349 and 350:
DETERMINING MORPHOLOGICAL AND BIOCH
- Page 351 and 352:
DIETARY MAGNESIUM AND GROWTH OF PAC
- Page 353 and 354:
EVALUATION OF WATER QUALITY FOR LIV
- Page 355 and 356:
THE EFFECTS OF SOYBEAN OIL, FLAXSEE
- Page 357 and 358:
REPLACEMENT OF FISH MEAL WITH SOYBE
- Page 359 and 360:
SATURATED LIPID KEY TO MAXIMIZING F
- Page 361 and 362:
CHANGES IN WHOLE-BODY FATTY ACID CO
- Page 363 and 364:
EYE COLOR AS A PREDICTOR OF SOCIAL
- Page 365 and 366:
INCREASING LEVELS OF DIETARY CARBOH
- Page 367 and 368:
DEVELOPING VALUE-ADDED PRODUCTS FRO
- Page 369 and 370:
PROGRESS AND CONSTRAINTS TOWARD COM
- Page 371 and 372:
EFFECT OF CULTURE DENSITY ON PRODUC
- Page 373 and 374:
BAYESIAN METHODS FOR DETERMINING TH
- Page 375 and 376:
GROWTH PARAMETERS OF WILD AND SELEC
- Page 377 and 378:
QUALITY ASSESSMENT OF ATLANTIC STUR
- Page 379 and 380:
SMALL-SCALE, LOW-INPUT AQUACULTURE:
- Page 381 and 382:
IMMUNIZATION OF CATFISH WITH INACTI
- Page 383 and 384:
STRATEGIES OF NILE TILAPIA (Oreochr
- Page 385 and 386:
AN ORAL DELIVERY SYSTEM FOR DNA VAC
- Page 387 and 388:
AQUATIC RESOURCE USE AND CONSERVATI
- Page 389 and 390:
DIFFRENTLY EXPRESSED ANTIOXIDANT GE
- Page 391 and 392:
EFFECT OF SALINTY, AMMONIA AND FORM
- Page 393 and 394:
GROTH PERFORMANCE AND RESISTANCE TO
- Page 395 and 396:
EFFECTS OF LOADING DENSITY ON GOLDE
- Page 397:
STUDIES WITH HEAT SHOCK PROTEIN STI